Explore the documentation
- INTRODUCTION
- | LLPS SOURCES
- STATISTICS on LLPS SET
- | FULL-SEQ vs DISO-FRAGS
- | LOCAL FRAGMENTS
- | SEQ & STRUCT MOTIFS
- BROWSE SINGLE SEQUENCE
- | AA COMPOSITION & LCR
- | CHEMICAL PATTERNS
- | SEQUENCE CONSERVATION
- | SECONDARY STRUCTURE
- | SOLVENT ACCESSIBILITY
- | STRUCTURAL DISORDER
- | CONTACT MAP
- | SHORT MOTIFS SEQ
- DOWNLOAD
- TOOLS & REFERENCES
- LICENSE & FAQ
Last update: November 2021
The liquid-liquid phase separation of partially or fully disordered proteins has recently emerged as the critical mechanism underlying cellular order and
regulation in biology. Thanks to the recent findings, we now know that protein sequences not only encode for 3D folds but also explicitly encode for the disorder.
The functions of disordered proteins can frequently be realized through the formation of phase-separated condensates, which in turn serve vital catalytic, ordering, and
regulatory roles. A significant knowledge gap, however, remains before we can unlock the sequence "codes" of phase-separation, thereby paving the way for the design of new
medically and synthetically relevant phase separating sequences. The knowledge gap is exacerbated by the lack of computational infrastructure, which could provide both
experimentalists and computational scientists with centralized, open-source, and data-driven tools for studying phase-separation of disordered proteins. As a result,
theoretical progress has been slow to date, with most of the studies being driven by intuition and trial and error approaches when reconciling experiments.
To address this knowledge gap, we are compiling a centralized database BIAPSS for learning about the biophysics of protein phase-separation in a data-driven way.
Specifically, we envision several broad use cases for the BIAPSS:
• for getting a broad overview of detailed residue-resolution biophysical characteristics for all reported phase separating-protein sequences,
• for analyzing individual protein sequences for inferring phase-separating affinities and for identifying "sticky"
fragments,
• for preparing training and testing sets for energy-based sampling via classical MC or MD simulations.
The following is documentation on how to browse the single LLPS sequence analysis results and how to interpret the statistics on the
complete LLPS dataset stored in the BIAPSS database. Please see proper tabs below or relevant papers listed in the TOOLS & REFERENCES section for a detailed
explanation of the analysis stages and used tools.
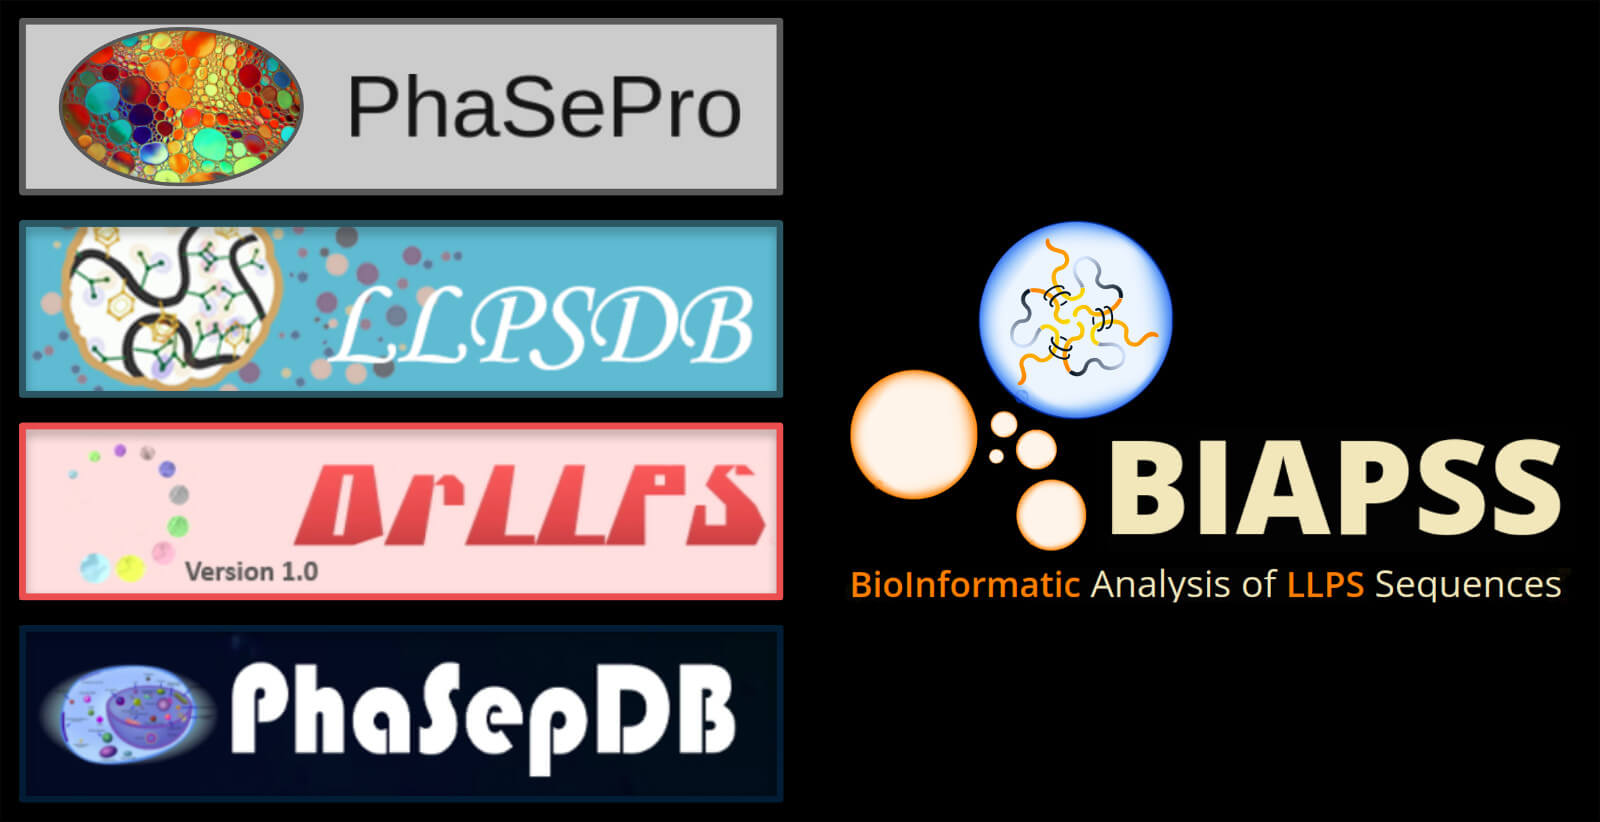
Our database contains comprehensive bioinformatic analyses for 501 unique LLPS sequences collected as a joined set (superset) of manually curated cases deposited
in the primary LLPS databases: PhaSePro (121 entries),
LLPSDB (198 entries), and the reviewed subset of PhaSepDB.v1 (352 entries).
BIAPSS incorporates an extensive cross-reference section that links all entries to primary LLPS databases (including DrLLPS)
and other external resources (e.g., Uniprot, DisProt, Human Protein Atlas, Structure DBs including Alpha Fold structure predictions), thereby serving as a central
navigation hub for the phase separation community.
The majority of collected sequences encode naturally occurring proteins with an assigned UniProt code and annotations in related databases. The analyzed proteins
come from 49 different organisms, and 286 sequences are human. The length of a single sequence varies from 69 to 3908 amino acids, while the average LLPS sequence length
is 706 residues (see the overall summary and related charts in the MultiSEQ subpage).
The phenomenon of liquid-liquid phase separation of proteins is of growing interest due to its involvement in numerous biological processes, including RNA metabolism,
signal transduction, gene regulation, and neurodegenerative disease-related mechanisms. There are numerous reports of phase-separating proteins in the literature from both
experimental and theoretical studies. The studies so far, however, analyze results on a case by case basis without putting sequences in the broader context of a compiled
database, which would enable inferring statistical significance of findings. Additionally, the basic mechanisms and sequence “codes” of LLPS proteins remain
unknown. To make progress towards a better understanding of the general mechanisms of LLPS, it is important not only to systematically analyze rapidly emerging
experimental data for new cases but also to perform an in-depth statistical analysis of all protein sequences prone to phase separation.
Our statistical approach towards the LLPS dataset delivers a broad overview of general biophysical characteristics and regularities common for known phase separating protein
sequences. This makes it possible to infer certain overall regularities that may be helpful not only to identify efficiently phase-separation-prone sequences but also
in designing modifications that favor certain biomedical applications.
A comprehensive statistical analysis on a set of sequences prone to phase separation was carried out on 3 levels:
• entire LLPS sequences
• structurally disordered fragments of LLPS sequences
• short 20 amino acid segments along the LLPS sequences
For all sequences as well as structurally disordered fragments, the length distribution, amino acid composition, chemical characteristics (fraction of polar,
hydrophobic, aromatic, charged residues), prediction of secondary structure, solvent availability, structural disorder, charge decoration pattern were examined.
You can explore the results of those analyses in applications on the MultiSEQ subpage (Statistics,
AA Composition, Chemical Properties, Charge Decoration) or read the detailed documentation in DISORDERED FRAGMENTS tab.
Analysis of short 20 amino acid fragments provided a comparison of local charge distribution, compositionally diversity of amino acid in the sequence
(AA diversity) and identification of amino acids occurring locally in excess (rich AA) between the fragments extracted along:
• original LLPS sequences (501 entries)
• structurally disordered LLPS regions (1787 fragments)
• sequences from the SwissProt database, which serves as a reference set
You can explore the results of those analyses in LOCAL FRAGMENTS application on the MultiSEQ subpage
or read the detailed documentation in LOCAL FRAGMENTS tab.
The recent findings suggest that flexible, intrinsically disordered fragments containing specific short motifs or repeated low-complexity regions can form
multiple interactions that are the driving force behind phase separation.
Our analysis confirms that the vast majority of sequences identified as LLPS-dependent (466 out of 501) show the presence of structurally disordered fragments.
In total, we detected 1787 disordered fragments, including 1154 fragments longer than 20 amino acids, where the average length of the predicted disordered fragment
is 67 residues and the average fraction of disordered residues in an LLPS sequence is ~40% (for details see MultiSEQ subpage).
The amino acid distribution in disordered fragments compared to overall amino acid composition of LLPS sequences indicates a significantly increased content of
hydroxyl-containing polar serine and threonine, a slightly increased fraction of strongly negatively hydropathic glutamic amid and acid (E, Q) or simple amino acids
supporting the conformational flexibility (G, A) and the noticeable reduction in the fraction of hydrophobic and aromatic amino acids (F, W, Y, I, L, V) which in
general are not typical of flexible fragments exposed to the solvent.
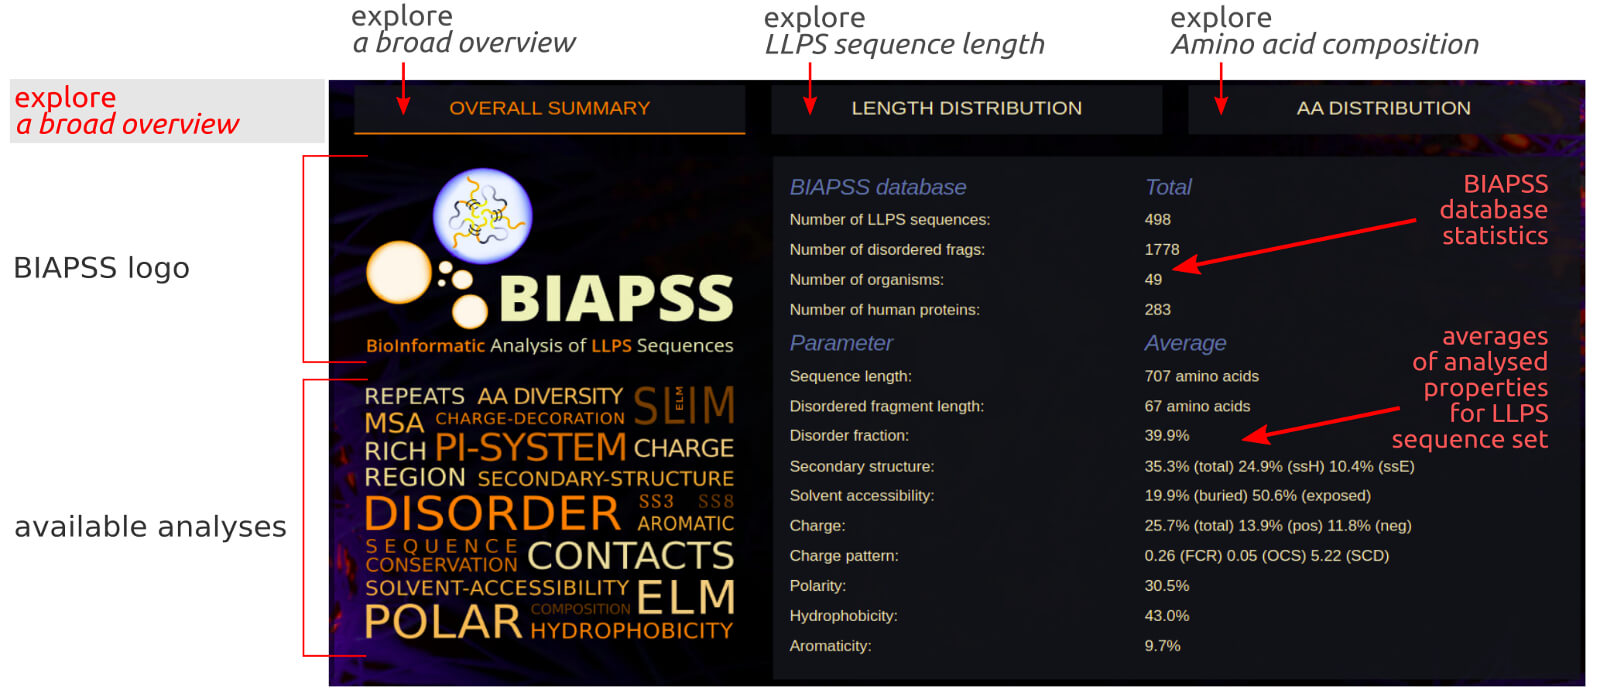
The page contains a general summary of the BIAPSS database content and a list of average values of analysed parameters over the complete set of LLPS sequences.
Such a rough summary may give a glimpse into the LLPS protein set compared to other reference sets, while deeper analysis is further provided in our interactive applications.
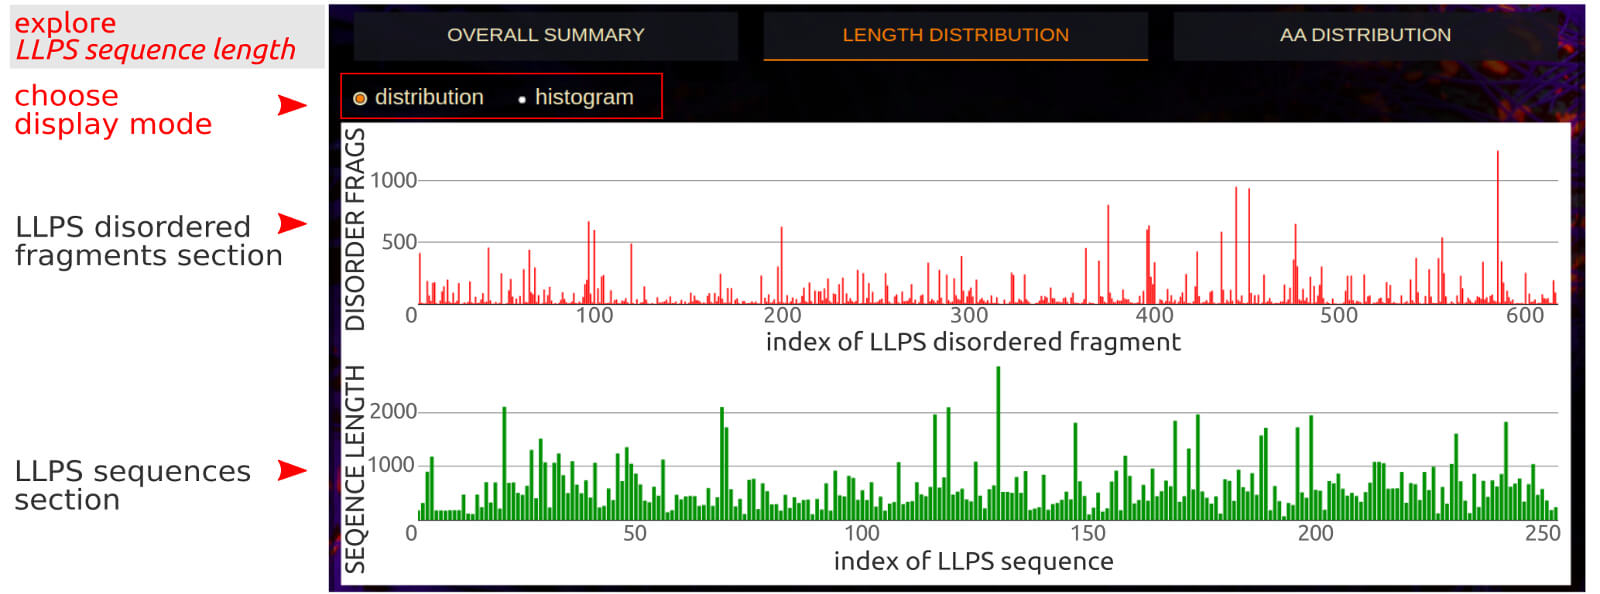
The Length Distribution application allows to simultaneously review the distribution of the length of LLPS sequences and the disordered fragments extracted
from them in two switchable modes: presentation of lengths for individual sequences/disordered fragments and histogram view, respectively. An interactive label in
distribution mode identifies the order index of the sequence/fragment in the database, the length of the sequence and its UniProt code, respectively. An interactive
label in histogram mode identifies the range of the sequence length and counts of the corresponding sequences. The selected part of the chart can be easily enlarged with
the automatic Plotly buttons on the top right.
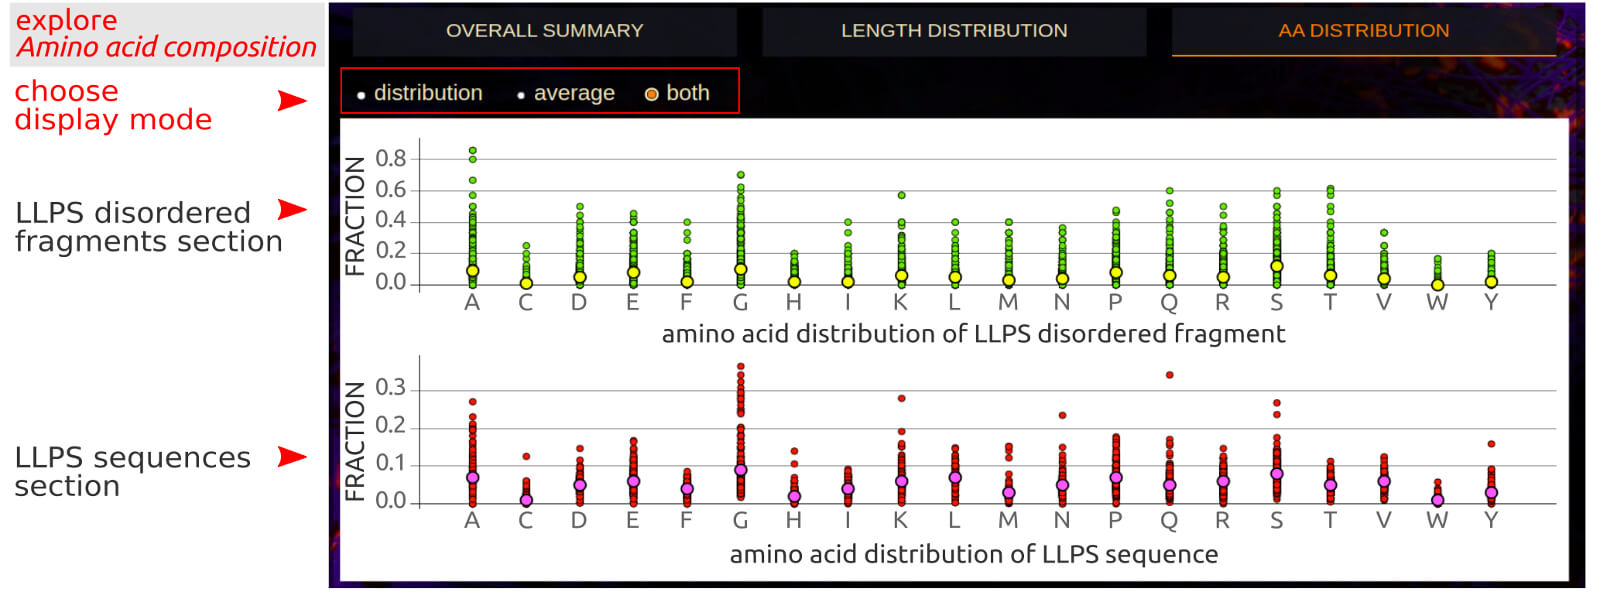
The Amino Acid Distribution application allows for a simultaneous comparison of fractions of each of the 20 biogenic amino acids in a set of LLPS sequences
and structurally disordered LLPS fragments. There are 3 display modes to choose from: distribution, where an interactive label indicates the fraction of a
given amino acid in a given LLPS sequence; average, where an interactive label indicates the average and standard deviation of the fraction of a given amino acid
in the LLPS sequences set; both, where the average value is shown in relation to the distribution of fractions.
The below figure shows the overview result app-page, which consists of a couple of sections describing the comparison of amino acid composition for all LLPS sequences
as well as short (<20 amino acids) or long (≥ 20 amino acids) LLPS disordered fragments referred to statistics for other protein groups or organism kingdoms.
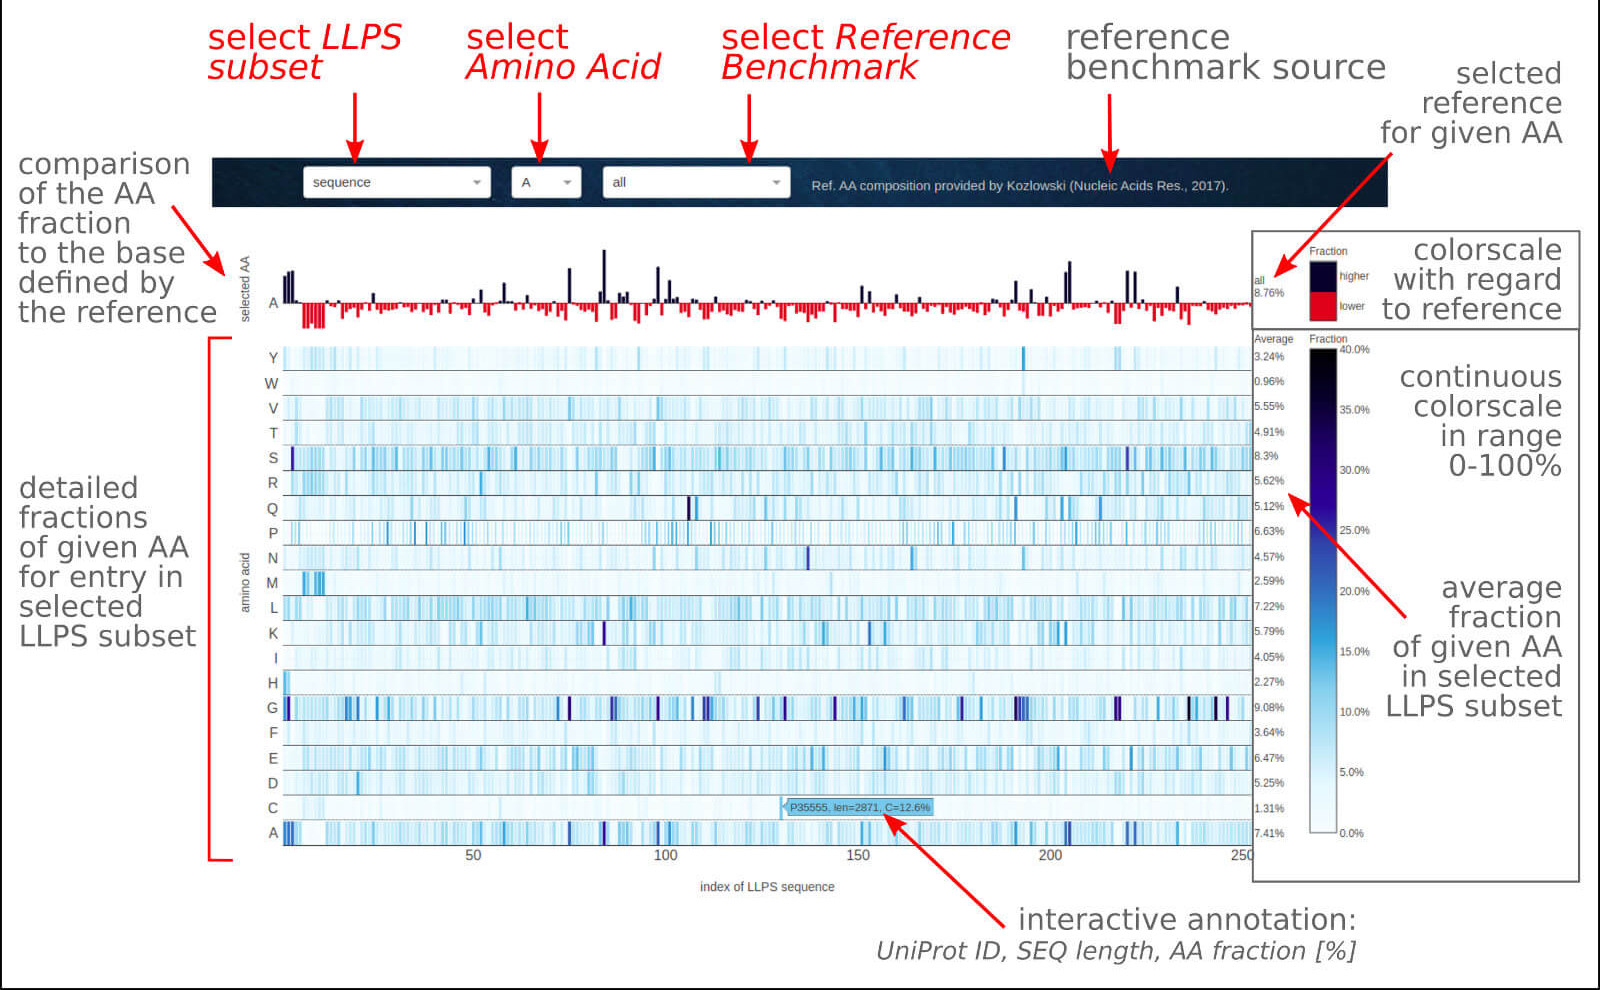
0) Dropdown options. The user may select the data subset among entire LLPS sequences, short or long LLPS disorder fragments. The second dropdown allows selecting
a particular amino acid type to compare its fractions with chosen benchmarked statistics for other groups of proteins or organisms that may be selected in the third dropdown menu.
1) The first top row is the content of the given amino acid type (2nd dropdown) for all entries from the selected data subset (1st dropdown) related to the benchmarked
fraction of the same amino acid in a reference dataset of proteins or organisms (3rd dropdown). The black and red bars indicate a higher and lower content of the selected
amino acid than in the reference, respectively. The reference content of the chosen amino acid for a selected reference set is given on the right as a percentage value.
It will change interactively when another amino acid type or reference set is selected.
2) The second section contains the fractions of individual biogenic amino acids in the selected LLPS data set (entire sequences, short/long disordered fragments),
compiled at a single view. Presentation on a color scale facilitates the conviction of the general trend in the amino acid composition of a set of LLPS proteins,
as well as allows for easy identification of interesting cases or comparison of the properties of the studied system against the background of the entire set.
The interactive label indicates the UniProt ID for the selected sequence, its length, and the percentage of the given amino acid content. The additional section on
the right contains the average fraction of a given amino acid in a selected data subset, which gives a reference when analyzing fractions for individual sequences.
Visit the Case Study section of the documentation to see what you can learn from this application.
The below figure shows the overview result app-page, which consists of a couple of sections describing the comparison of chemical characteristics for all LLPS sequences
as well as LLPS disordered fragments. With this application, one can investigate on a color scale the overall distribution of different chemical properties (polarity,
hydrophobicity, charge, aromaticity, π-systems) and deeper sequence-based predictions (secondary structure, solvent availability, structural disorder) in a complete
set of LLPS proteins. In particular, for predictions of secondary structure and availability for the solvent, the distributions of particular types of elements:
helical/extension and buried/exposed, respectively, were also presented. Thanks to the neat presentation of all properties on a single drawing, it is possible
to visually find certain correlations not only at the level of general trends for LLPS proteins but also in a comparative analysis or a case study.
![BIAPSS - Chemical Properties [polarity, hydrophobicity, charge, aromaticity, π-systems, secondary structure, solvent availability, structural disorder] of phase-separated sequences.](img/docs/12th-pic-item.jpg)
0) Dropdown options. The user may select the data subset among entire LLPS sequences or LLPS disordered fragments.
1) The main section contains the chemical characteristics and sequence-based predictions for all deposits from the selected LLPS data subset. On the right, one can find
the average value of each parameter for a selected LLPS data subset, which may be the reference point for a particular case study. The interactive label indicates
the UniProt ID for the selected sequence and the percentage of the residues meeting a given property criterion.
Visit the Case Study section of the documentation to see what you can learn from this application.
The below figure shows the overview result app-page, which consists of a couple of sections describing various charge decoration parameters (SCD, OCS, FCR) for all LLPS sequences
as well as LLPS disordered fragments. With this application, you can investigate on a color scale the overall charge decoration patterns on a complete
set of LLPS proteins.
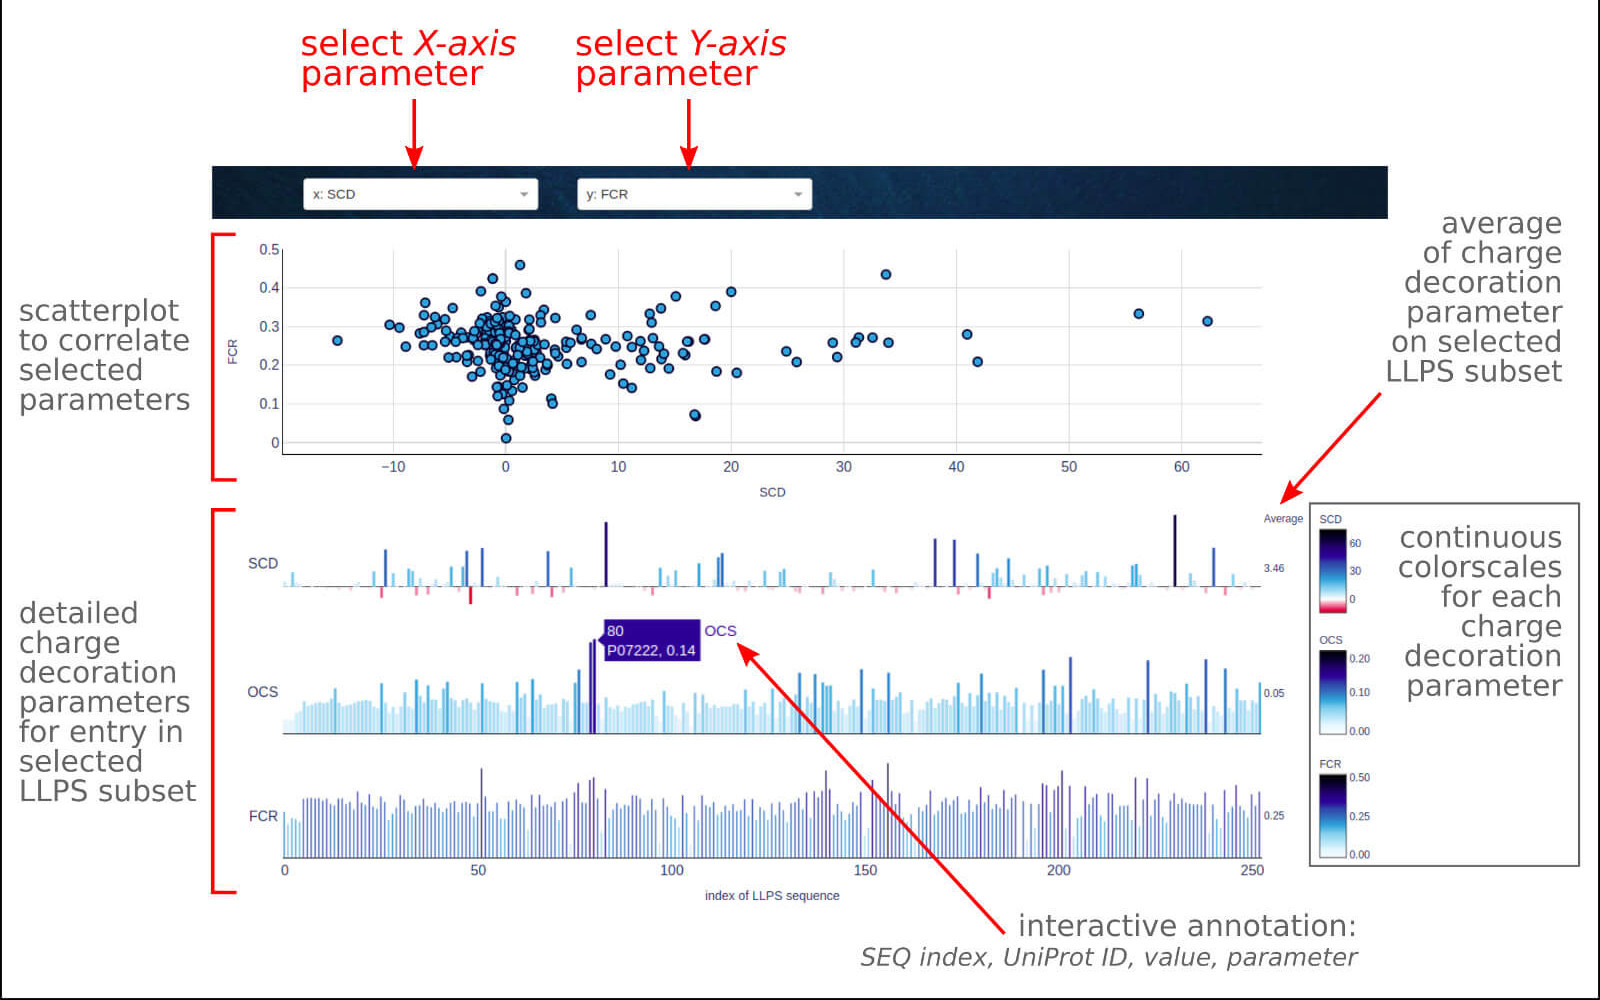
0) Dropdown options. The user may select the data subset among entire LLPS sequences or LLPS disordered fragments. The second and third dropdown menus allow to select
a parameter for the X and Y axis, respectively, for scatter plot in the top section.
1) The top section contains a scatter plot correlating two selected parameters of the sequence charge decoration. An interactive legend allows switching between
the displayed LLPS data subset.
2) The bottom section composed of 3 bar plots show the distribution of the given charge decoration parameter:
• SCD - sequence charge decoration, defined following Sawle & Ghosha
• OCS - overall charge symmetry, defined following Das & Pappu
• FCR - a fraction of charged residues, defined as a sum of the fractions of positive and negative charges.
On the right, one can find the average value of each parameter for a selected LLPS data subset, which may be the reference point for a particular case study.
The interactive label indicates the order index of the sequence/fragment in the database, UniProt ID for the selected sequence, and the value of a given parameter.
Visit the Case Study section of the documentation to see what you can learn from this application.
A rough analysis of an LLPS sequence described by a set of averages gives some general insight but conceal some local specificities that are important
for the interactions that are the driving force of the phase separation mechanism. For this reason, we conducted additional analysis on short 20 amino acid
long fragments extracted along the sequences with the 5 residues shift. The original LLPS sequences (253), structurally disordered LLPS fragments (568), and
sequences from the SwissProt set (561176, used as a reference benchmark) were fragmented. For these fragments, the distribution of charges (total, positive, negative),
the amino acid compositional diversity (AA diversity), and amino acid compositional uniformity (rich AA) were examined and compared with each other.
The below figure shows the overview result app-page, which compares the charge distribution (total, positive, negative) for 20 AA fragments derived from LLPS sequences
LLPS disordered fragments and SwissProt sequences.
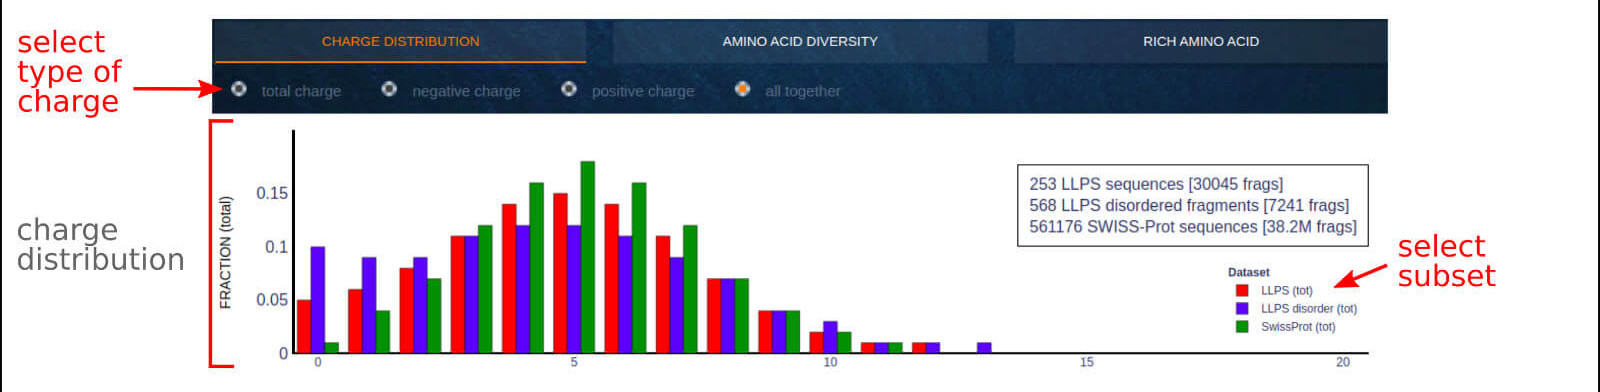
0) Radio button options. The user may select the displayed data subset among total charge, positive charge, negative charge, or all together.
1) An interactive legend allows switching between the displayed LLPS data subset. The interactive label indicates the number of charged residues per 20 amino acid fragment
and the fraction of residues with a particular type of charge.
2) The top right text area describes the counts of analyzed sequences and 20 AA fragments.
Visit the Case Study section of the documentation to see what you can learn from this application.
The below figure shows the overview result app-page, which compares the amino acid compositional diversity per 20 AA fragments derived from LLPS sequences
LLPS disordered fragments and SwissProt sequences. The diversity of composition is measured using two parameters:
• AA diversity - the number of diverse residues observed within 20 amino acid fragments,
• AA uniformity - the counts of the richest amino acid residue observed within 20 amino acid fragments that promote the detection of regions rich in a single amino acid type.
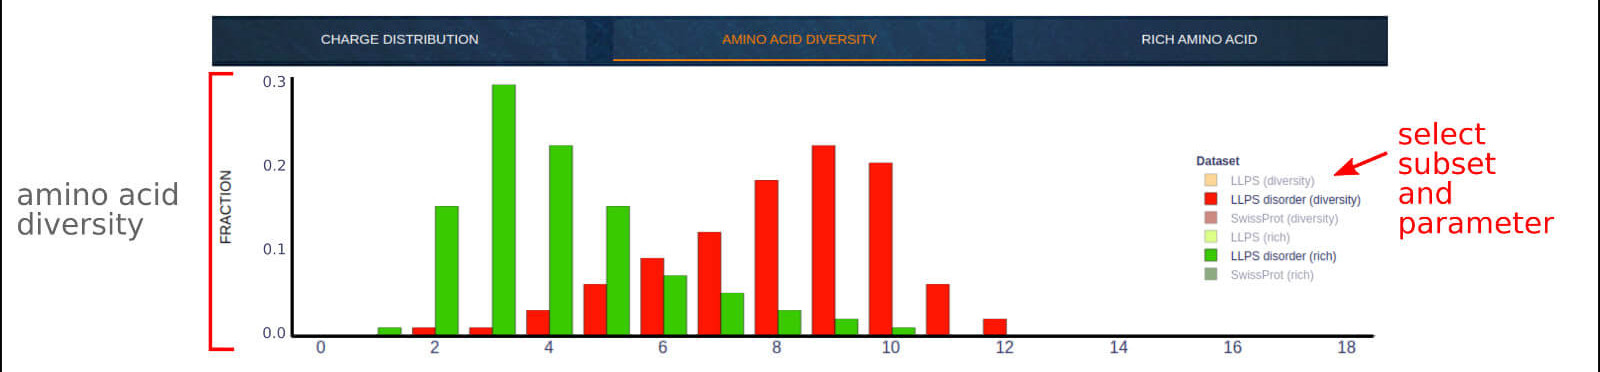
0) An interactive legend allows to switch between the displayed data subsets. The interactive label indicates the number of eligible residues per 20 amino acid fragment
and the corresponding fraction (counts) of fragments meeting the condition.
1) The top right text area describes the counts of analyzed sequences and 20 AA fragments.
Visit the Case Study section of the documentation to see what you can learn from this application.
The below figure shows the overview result app-page, which contains the detailed analysis of the richest amino acid residues (types and counts) observed within 20
amino acid fragments derived from LLPS sequences and LLPS disordered fragments compared to the SwissProt benchmark. With this application, one can detect the type of
key residues for the LLPS sequence (rich regions, presence in excess) as well as learn the pattern of their organization (counts per 20 AA fragment). A deeper analysis
of amino acids present in decreased content in LLPS sequences or LLPS disordered fragments may also bring relevant findings.
The heatmap describing the correlation of two the most abundant amino acids in the 20-residue long fragments (counts of each higher than 1) indicates the pair of
amino acids prone to be closely located in the sequence that may play an important role in interactions driving the phase separation.
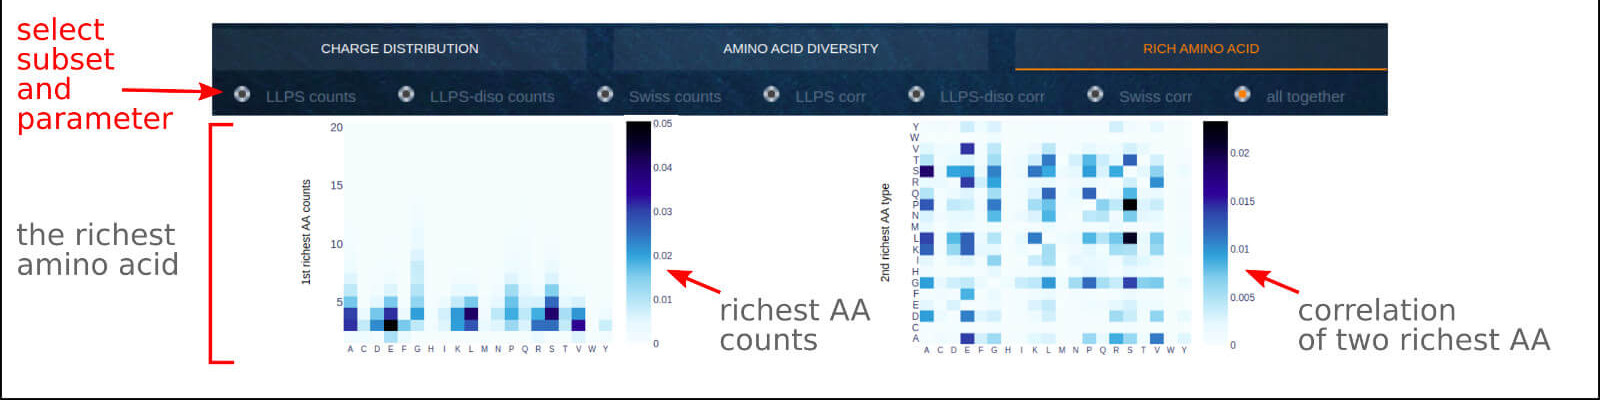
0) Radio button options. The user may select the displayed data subset among selected subset counts, selected subset correlation, or see all charts together (default).
1) The interactive label contains detailed scores for the selected point on the heatmap.
Visit the Case Study section of the documentation to see what you can learn from this application.
The Short Motifs application contains the sequence-based detection of short sequential and structural motifs divided into a few main groups:
• Eukaryotic Linear Motifs (ELMs),
• other known stretches of protein sequence such as Glycine-Arginine Rich regions (GARs) or phosphorylation sites,
• short structural motifs such as LARKS or steric zipper,
• common n-mers (from 3- to 14-mers) spread across LLPS sequences and tandem repeats detected in a given sequence.
Eukaryotic Linear Motifs are short stretches of adjacent amino acids experimentally validated in eukaryotic cells that are enriched in intrinsically disordered proteins
and are crucial for compact intermolecular interactions. The list of functional sites was downloaded from the ELM server
as a list of experimentally confirmed instances assigned to each of the 6 main classes:
• CLV - cleavage sites,
• DEG - degradation sites,
• DOC - docking sites,
• LIG - ligand binding sites,
• MOD - post-translational modification sites,
• TRG - targeting sites.
The ELM-related BIAPSS application uses the list of ELM instances defined by regular expressions as the keys to search various eucaryotic linear motifs
in known phase separation prone sequences.
The below figure shows the overview result app-page of the ELMs tab, which explores the overall presence of Eukaryotic Linear Motifs in LLPS sequences.
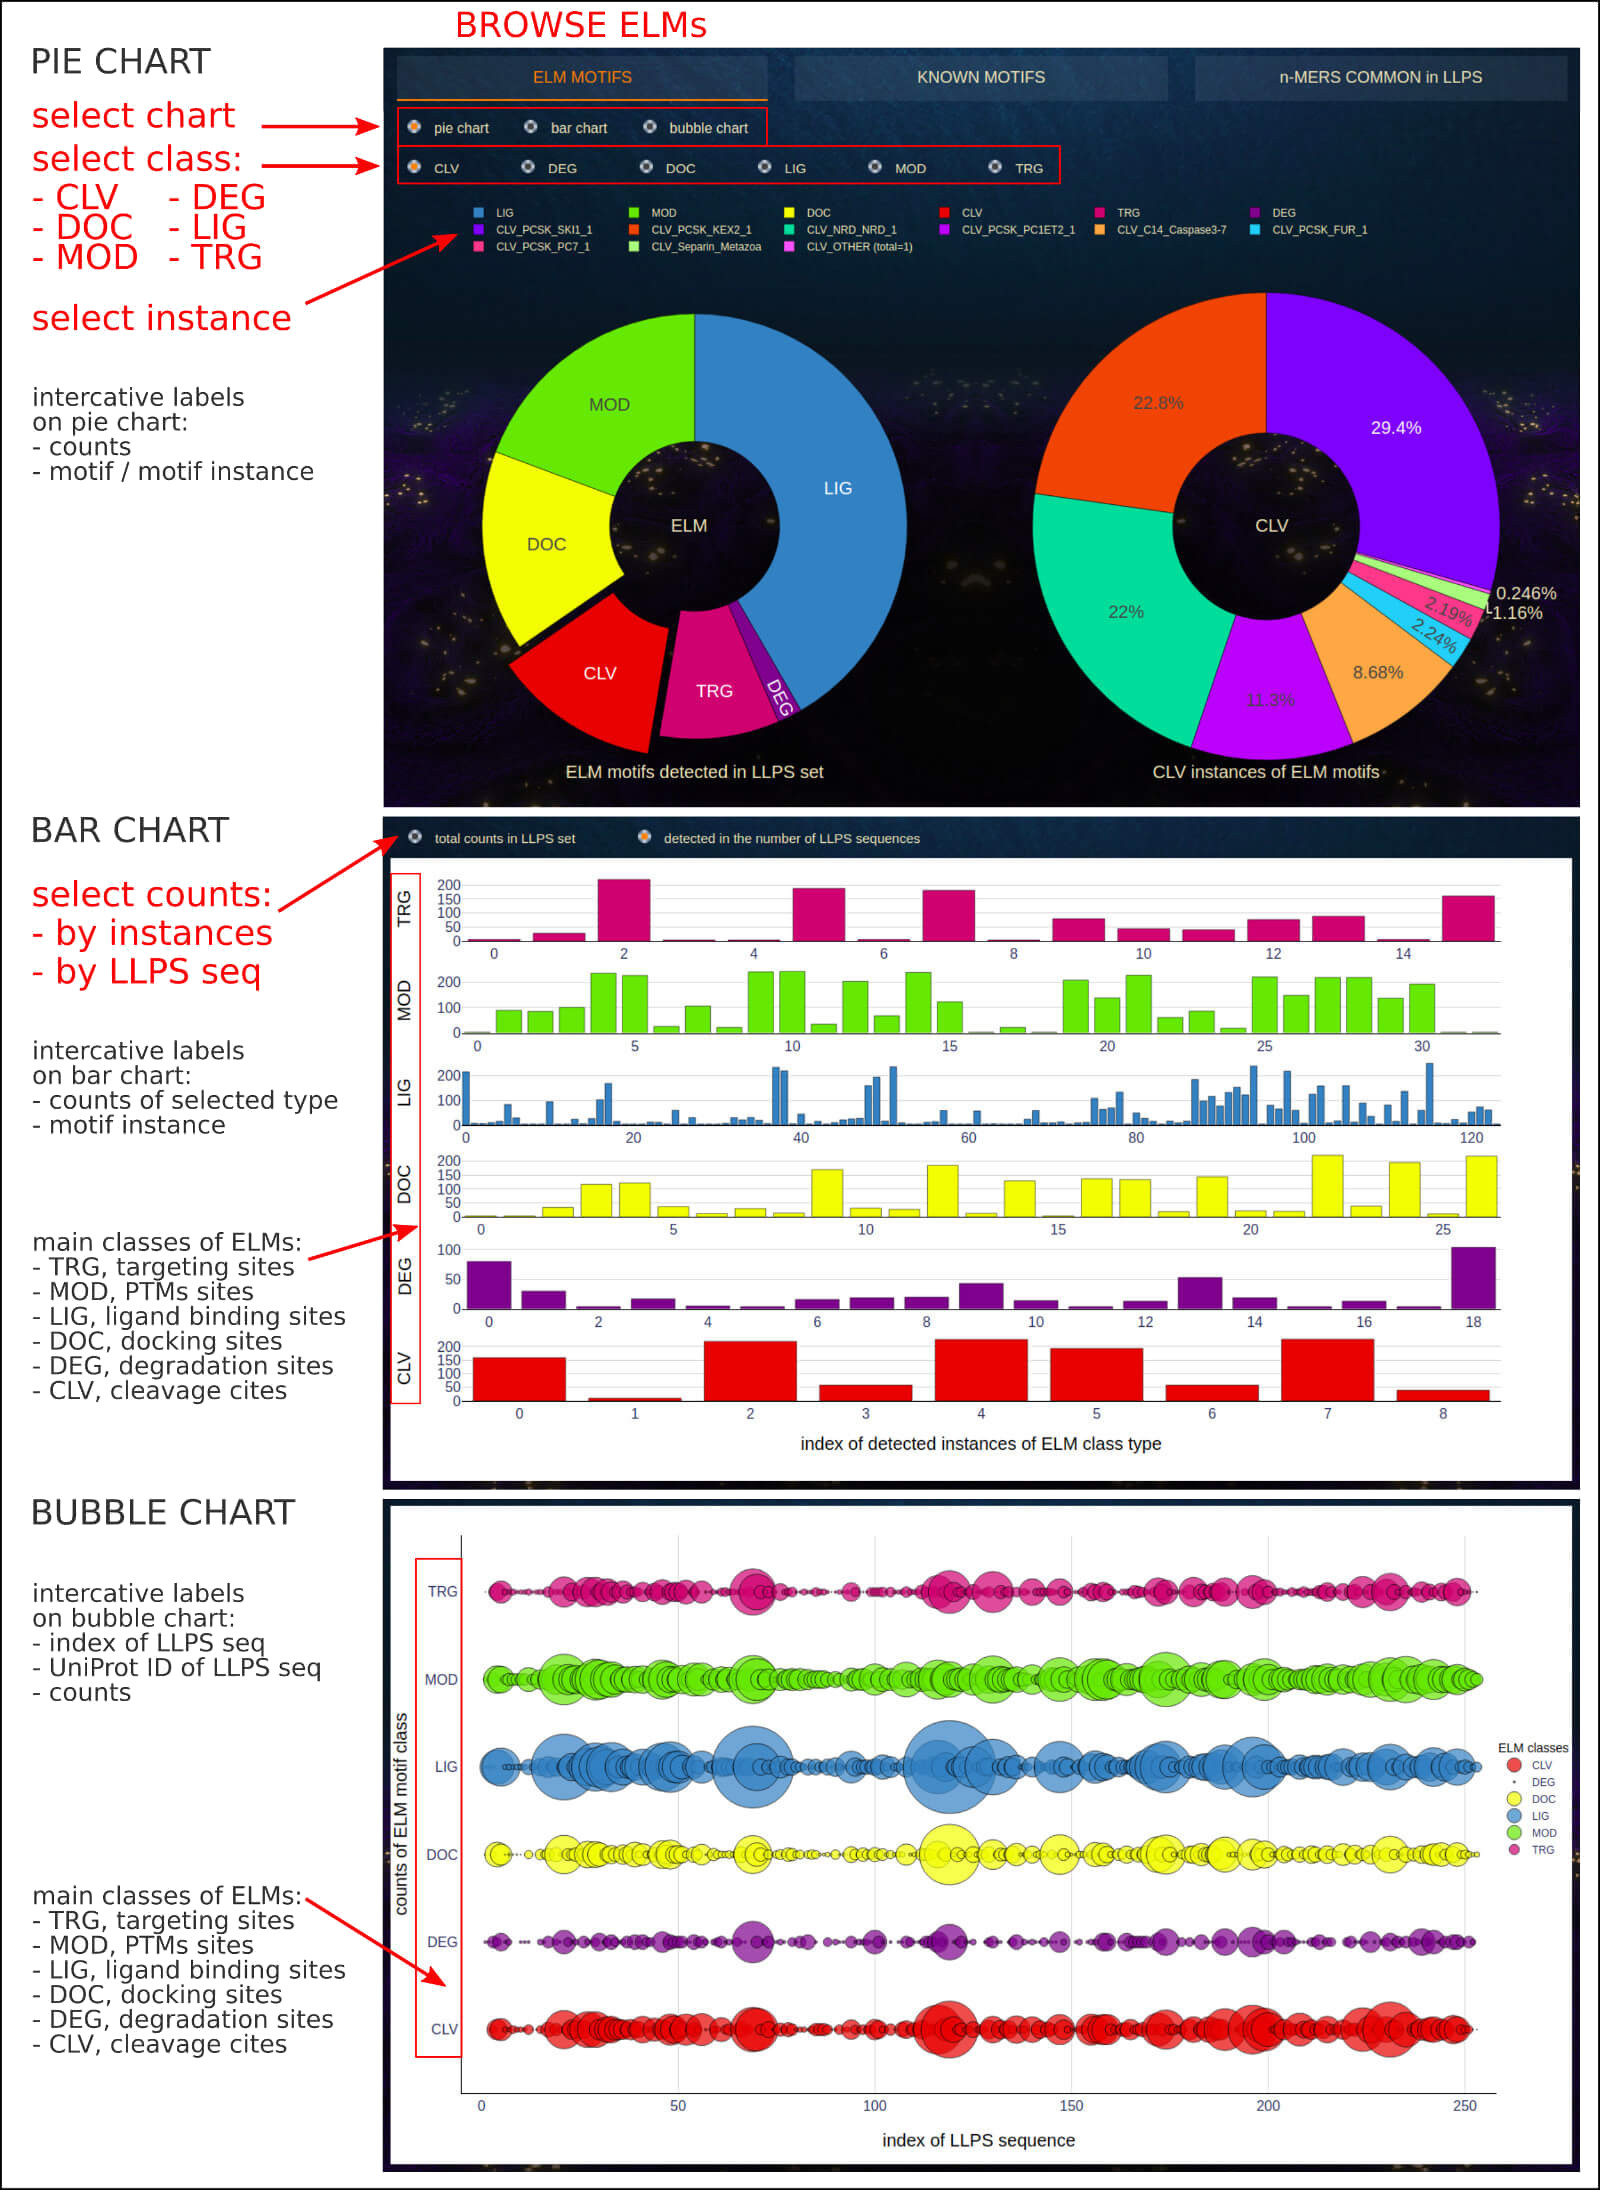
The user may select between pie, bar, or bubble charts to display ELM data.
Pie chart options.
The app-page consists of two interactive pie charts:
• on the left - the graph shows the percentage share of individual classes (CLV, DEG, DOC, LIG, MOD, TRG) in the total number of ELMs detected in LLPS sequences.
• on the right - the graph shows the percentage share of individual instances in the total number of selected ELM class detected in LLPS sequences.
The interactive labels indicate the ELM motif class/instance and its counts. An interactive legend permits excluding individual classes or instances from the statistics.
Visit the Case Study section of the documentation to see what you can learn from this application.
Bar chart options.
The app-page consists of a 6-row bar chart, where the single row is dedicated to instances of selected ELM class. The buttons allow determining the total frequency
of specific classes of ELM motifs, including detailed counts of individual instances and the number of unique LLPS sequences in which the motifs were detected.
Bubble chart options.
The app-page consists of a 6-row bubble chart, where the single row is dedicated to instances of selected ELM class. The bubble's size determines the total counts
of specific classes of ELM motifs detected in each unique LLPS sequence. The comparative analysis supports the identification of ELM's richest sequences as well as
the detection of the co-existence of various motifs.
Recent studies indicate many other short motifs along the sequence, whose tendency to multivalent interactions may suggest involvement in phase separation or aggragation:
• LARKS are the low-complexity, aromatic-rich, kinked segments, where the experimental
studies showed that the two of such short sequence fragments could bind weakly to each other by forming a pair of kinked β-sheets.
• steric zipper is a structural motif of the dry interface formed by the interdigitation
of complementary side chains via van der Waals interactions and hydrogen bonds such as Asn/Gln ladders.
• GARs are Glycine-Arginine-rich disordered protein regions with multiple RGG/RG repeats that
may bind nucleic acids via weak multivalent interactions.
• PTM is a modification of proteins that increases the functional diversity of the proteome by the
covalent addition of various functional groups.
The below figure shows the overview result app-page, which for a selected group of motifs shows the distribution statistics of their instances among LLPS-dependent
protein sequences.
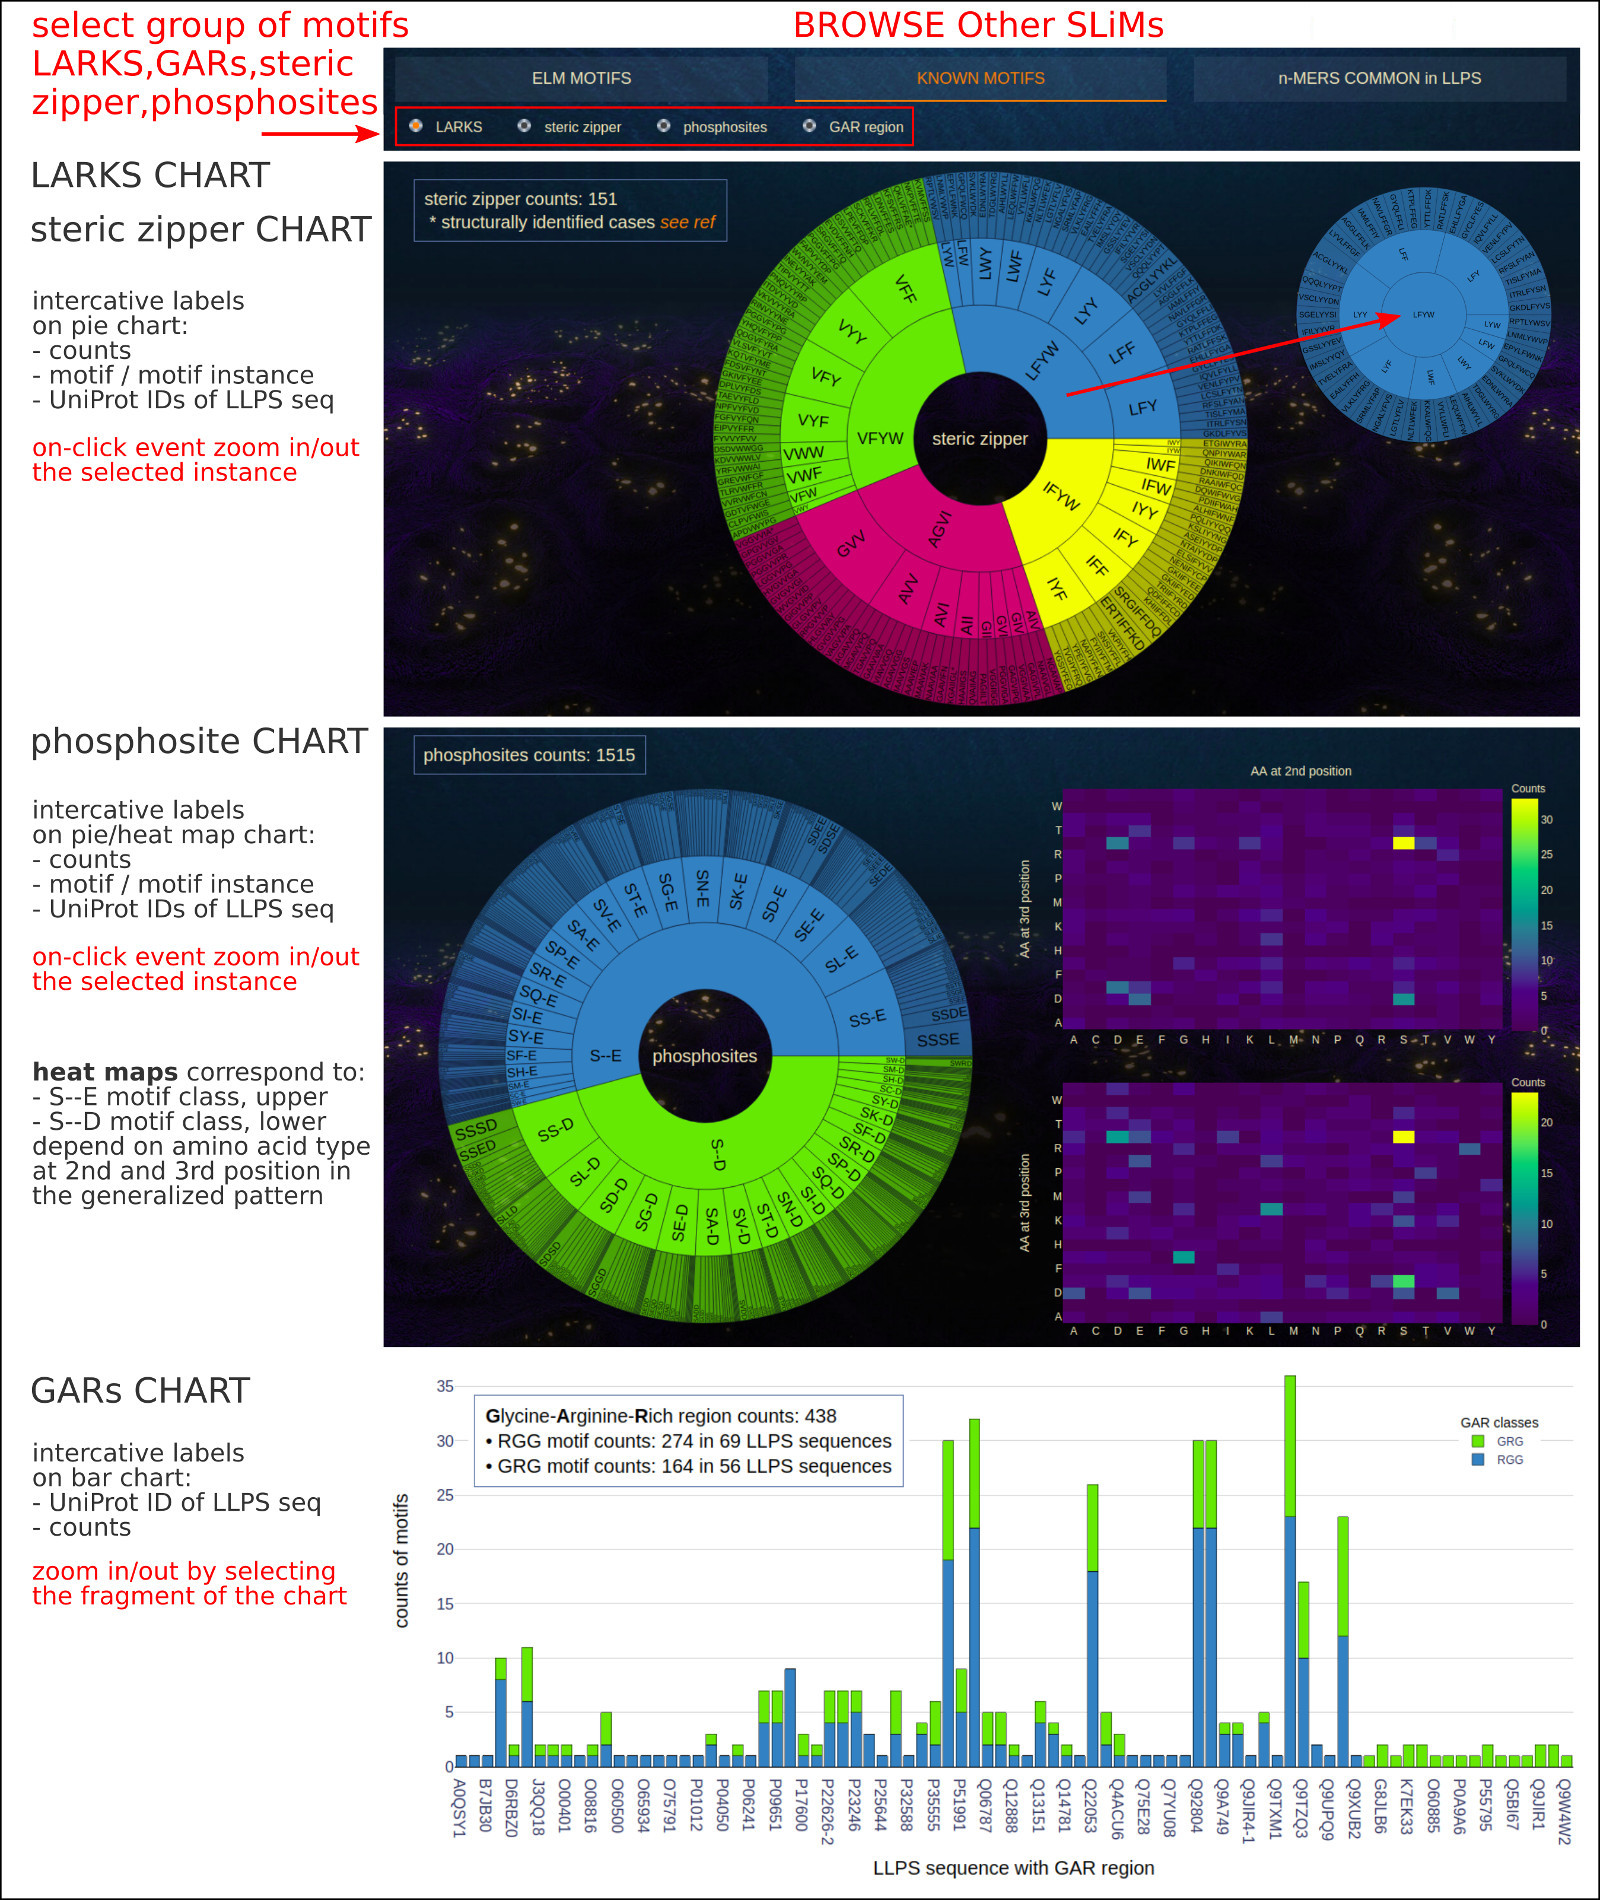
The Pie chart for each of LARKS, steric zippers, and phosphosites shows the counts of instances for the generalized pattern of motifs and a list of UniProt
IDs of LLPS sequences for which the particular instances were detected. The interactive on-click events allow for customized zooming in and out of the user-selected instances.
The Heat Map charts for phosphosite motifs allow users to track the frequency of specific instances of the motif according to their amino acid composition at
the second and third positions in the sequence fragment.
The stacked Bar chart for Glycine-Arginine Rich regions compares the distribution and counts of the two common instances of GARs (GRG/RGG) in the LLPS sequences.
This section presents the pioneering analysis of:
• n-mers (from 3-mers to 14-mers) that are common across LLPS sequences,
• core 3-mers and their elongated instances (up to 6-mers) that may prove to be new short multivalent stretches of LLPS sequences,
• the repetitions of n-mer instances closely adjacent to each other that form tandem repeats along given LLPS sequence.
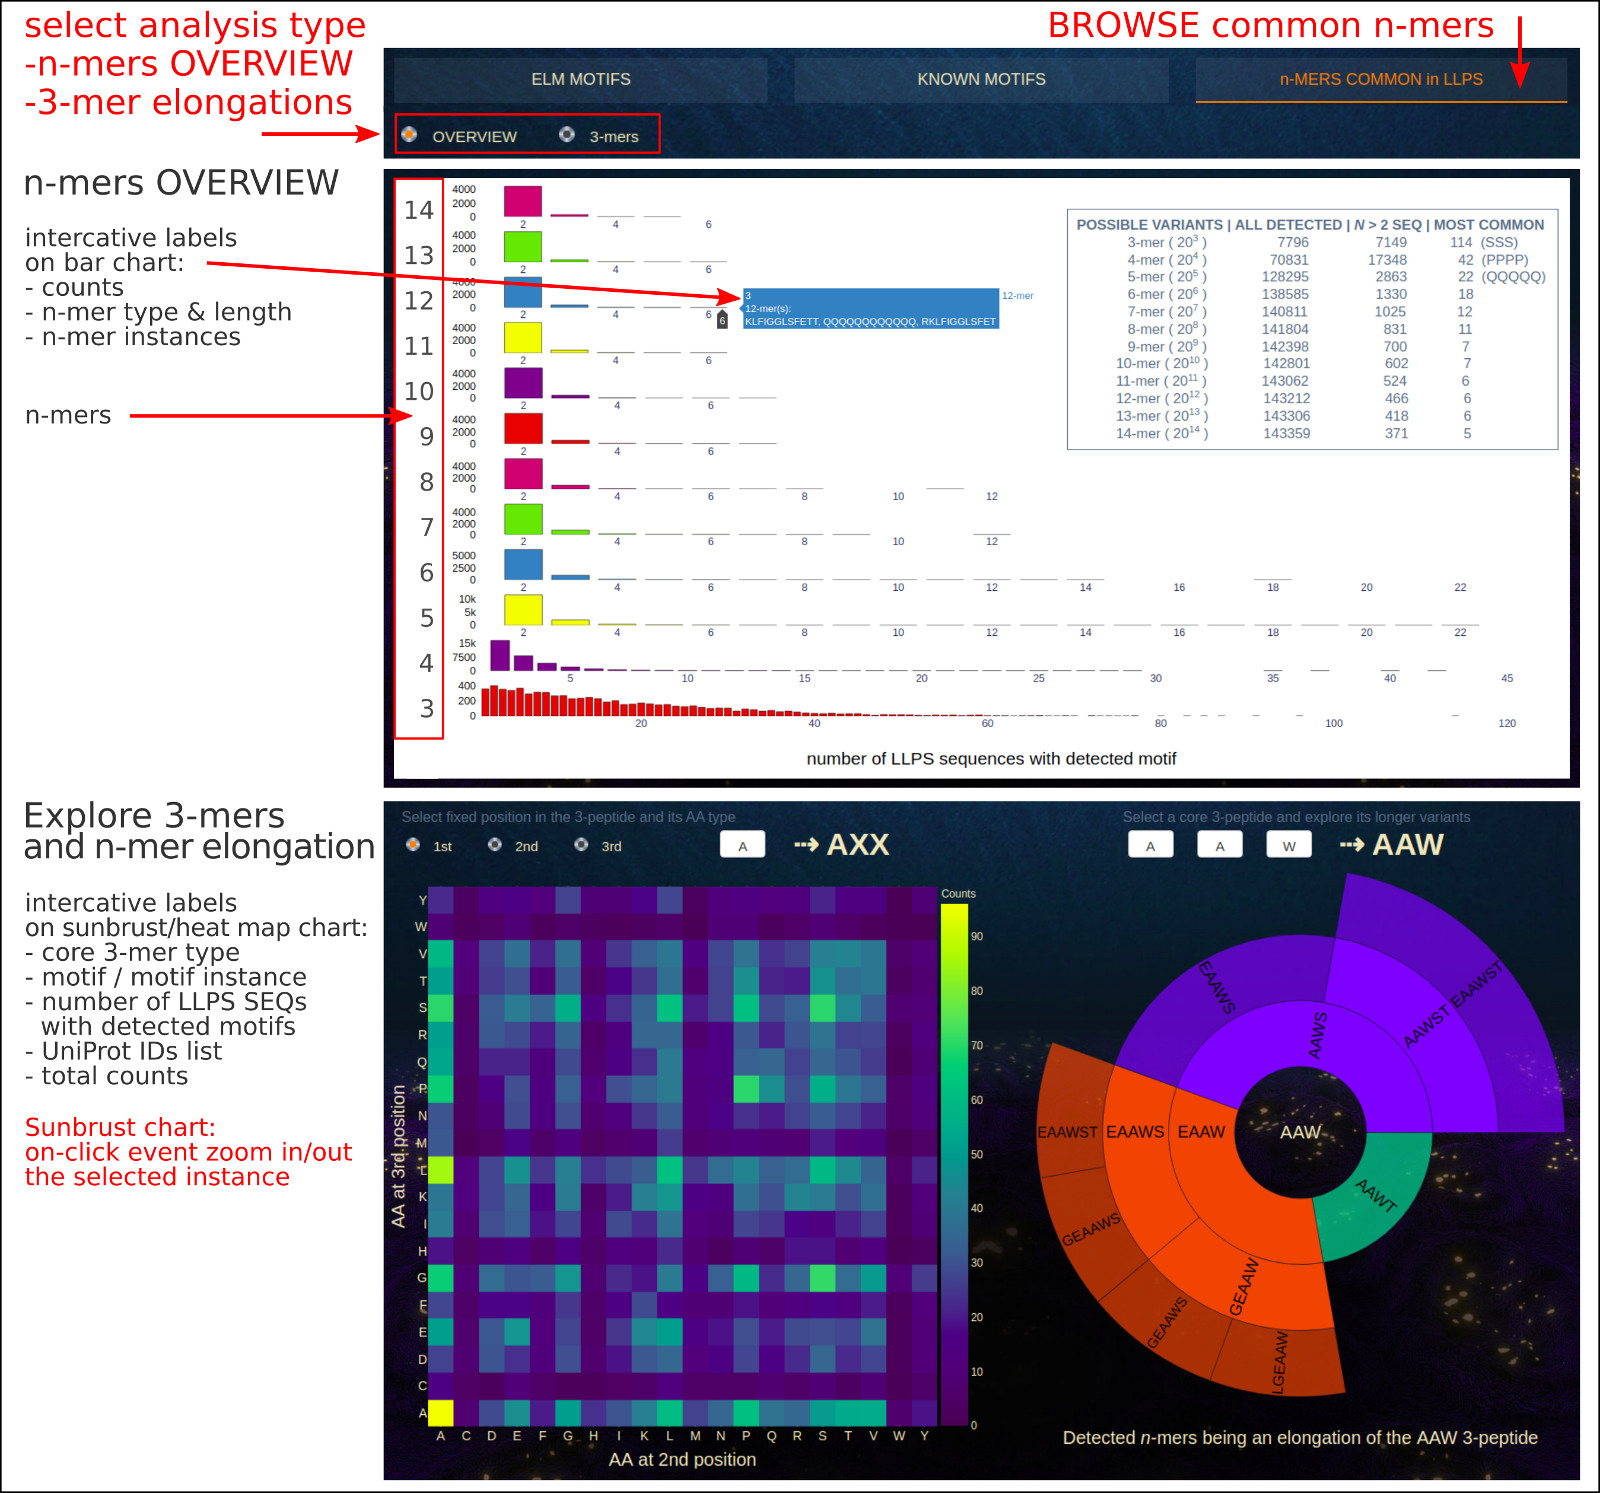
The Bar chart, which appears when the OVERVIEW button is selected, shows the distribution of n-mers (3- to 14-mers) which were found in at least 2 LLPS sequences.
From the app, you can learn about the most common short fragments of various lengths that occurring in many LLPS sequences and explore detected instances.
In the upper right corner there is a brief summary of statistics, where the following parameters are provided:
- possible variants - total number of all possible fragments of length n created from 20 standard amino acids,
- all detected - number of unique fragments of length n that have been detected in at least one LLPS sequence,
- n > 2 SEQ - number of unique fragments of length n that have been detected in at least three LLPS sequences,
- most common - number of LLPS sequences in which the most common instance of n-mer was detected, e.g. SSS as the instance of 3-mers was detected in 144 LLPS sequences.
The interactive on-hover annotations allow for a detailed analysis of the user-selected n-mers and their most common instances detected in the set of LLPS protein sequences.
The 3-mers button activates the app exploring the core 3-mers and their elongated instances (up to 6-mers) that may prove to be new short multivalent stretches of LLPS sequences.
The heat map on the left allows users to track the frequency of specific instances of the 3-mer according to their amino acid composition. Using the available options,
the user may select the fixed position in the 3-peptide (XXX) and its amino acid type, while the amino acids at two remaining positions are encoded on a 2-dimensional map.
When an interesting 3-mer (e.g. very common in LLPS sequences) is detected, the user can use it as an input to investigate more deeply the detected elongations of a core
3-peptide in a set of LLPS sequences. This is possible on the right in the Sunburst chart. The interactive on-hover labels include core 3-peptide type,
elongated motif instance, number of LLPS sequences with detected motif and list of UniProt IDs, total counts.
The structure, dynamics, and biological functions of proteins is a direct function of the physicochemical attributes of amino acids encoded in the primary sequence.
The specific patterns of chemical properties, i.e., charge decoration, polarity, hydrophobicity, aromaticity, as well as the content of acidic, basic, sulfur, or hydroxyl groups,
determine the network of intra- and inter-molecular interactions. The recent scientific findings suggest that multivalent, weak interactions involving both globular,
folded protein domains, and intrinsically disordered fragments take the key role to drive the liquid-liquid phase separation process (LLPS).
We believe that a compressed and comprehensive analysis of key biophysical properties, as well as other one-dimensional characteristics of protein sequence, visualized
on a single chart gives a deeper glimpse into the correlation between basic features and detections of sensitive regions for key interactions.
The below figure shows the overview result sub-page, which consists of a couple of sections describing the amino acid composition and complexity of given LLPS sequence.
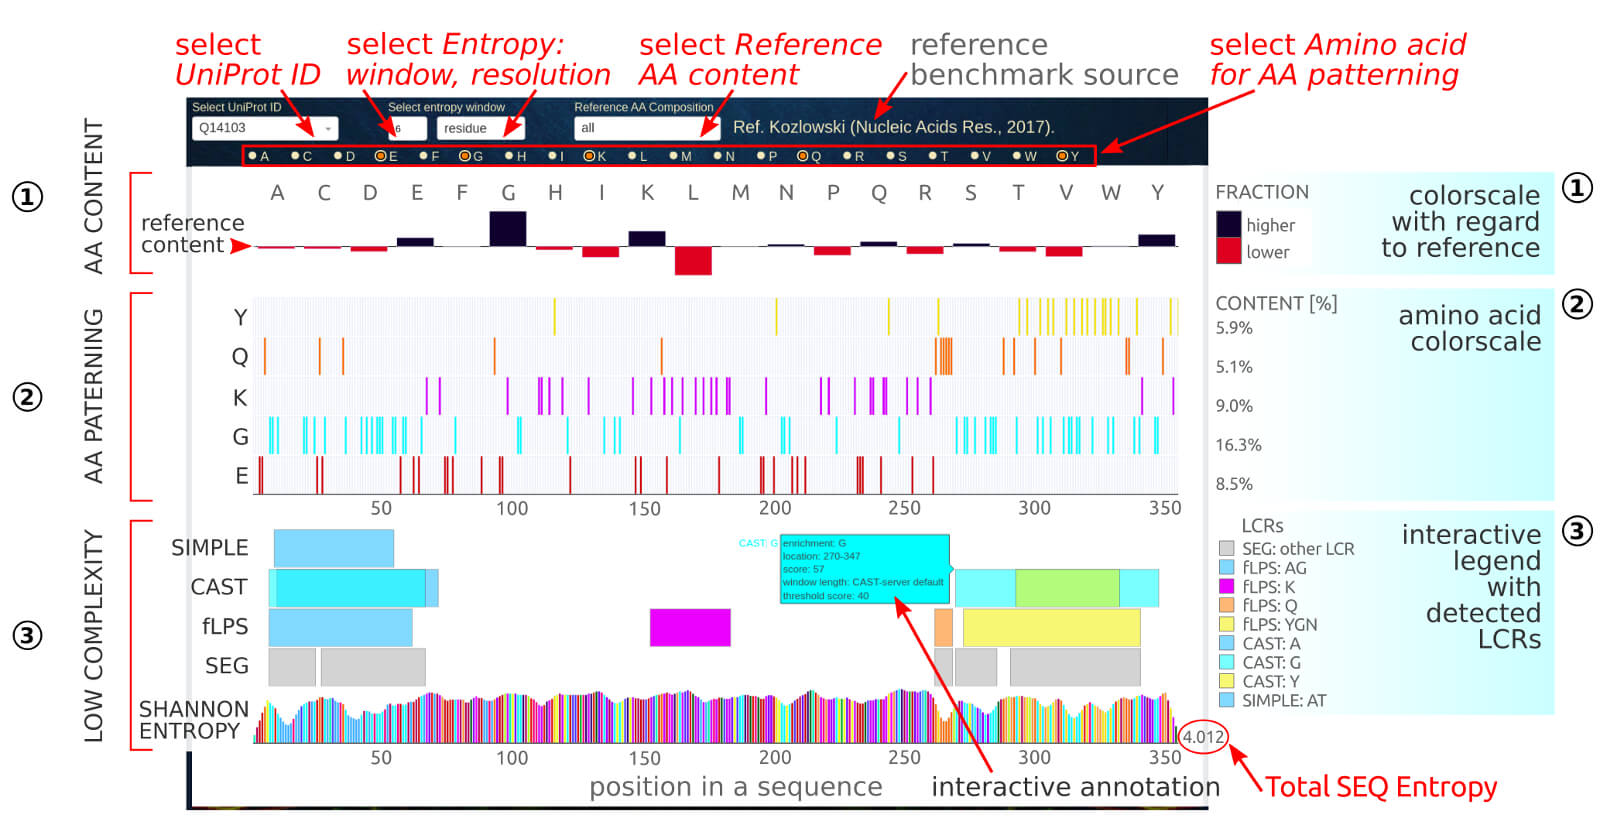
0) Dropdown options. The user may select LLPS sequence by its UniProtID (1st dropdown). The second and third dropdown allows to select the window length and
resolution, respectively, of the Shannon Entropy. This measure shows the information content of the protein sequence. The recommended window length is between
5 and 20. The results can be displayed in:
• residue resolution mode (residue option; smoother output):
$$S_{(i)}=\frac{1}{N}\sum_{j=1}^N\S_{(j)}$$
where the Shannon entropy, S(i), at sequence position i is a sum of entropies at all windows containing this position normalized by the
window length N.
• window resolution mode (block option):
$$S_{(j,N)}=-\sum_{aa=1}^{AA=20}f_{aa}\log_2(f_{aa})$$
where the Shannon entropy, S(j,N), at j-th sequence window of length N is summed over the fractions, faa,
of 20 biogenic amino acids. The value is assigned to the center position within the window. S(j,N) ranges from 0, where only one residue is present
within the sequence window) to log2(N) (all positions are different). Therefore, the lower the Shannon entropy, the less complex sequence is.
The fourth dropdown allows to select reference statistics (amino acid contents) for various subsets of protein sequences, including:
• TYPE: globular or membrane, Ref. Gromiha et al. (Comput Biol Chem. 29(2), 2005).
• ORGANISM: virus, archaea, bacteria, eukaryota, all_organisms, Ref. Kozlowski (Nucleic Acids Res. 45(D1), 2017).
• DATABASES: SwissProt, PDB, DisProt, BIAPSS (llps and llps disordered regions), Ref. Badaczewska et al. (in press, 2021).
• LINKER REGIONS: eukaryota, bacteria, archaea, Ref. Basile et al. (PLoS Comput Biol. 15(7), 2019)
• MEMBRANELESS COMPARTMENTS within: bacteria, archaea, endosome, ER, mitochondrion, golgi, vacuole, lysosome, plastid, cytoplasm, peroxisome, nucleus, extracellular, Ref. Basile et al. (PLoS Comput Biol. 15(7), 2019)
1) The AA content section provides the detailed contents of 20 biogenic amino acids in the individual LLPS sequence referenced to the user-selected (4th dropdown)
benchmark dataset of various groups of proteins. The reference content is the baseline, while the SEQ contents indicate an excess or deficiency of a particular
amino acid as dark-blue and red bars, respectively. The interactive labels contain the frequency of given amino acid in both, the sequence and reference dataset.
2) The AA patterning section shows the sequence decoration of particular amino acids, by default, those into which the sequence is enriched. The useer can customize
AA patterning by checking additional ones in the checkbox option section.
3) The low-complexity section provides regions of low-complexity (LCRs) detected by using several state-of-the-art tools, such as SIMPLE, CAST, fLPS, and SEG.
The original hits were parsed by the BIAPSS algorithms to merge overlapping regions enriched in different amino acids and only the integrated and unified data is displayed.
For each LCR, the interactive label contains the list of enriched amino acids, detailed location, score, and setting parameters used to obtain the result. The set of visible
LCRs can be controlled via the interactive legend.
The lowest row in this section shows the Shannon information content of a protein sequence (Shannon Entropy, S), which is calculated on-the-fly by the BIAPSS algorithms
based on the user-selected Entropy window (2nd dropdown) and displayed Entropy resolution (3rd dropdown). In the end of the row, the total Shannon Entropy
calculated over the entire sequence is provided and its range is between 0 and 4.32 (log2(20)). Some of recent studies
[ref,
ref] indicate that the Shannon entropy
score of sequence lower 2.9 can signify that protein is ordered, on the other hand, if the Shannon entropy is very high then the protein is disorder.
The below figure shows the overview result sub-page, which consists of a couple of sections describing the chemical properties patterns of a given LLPS sequence.
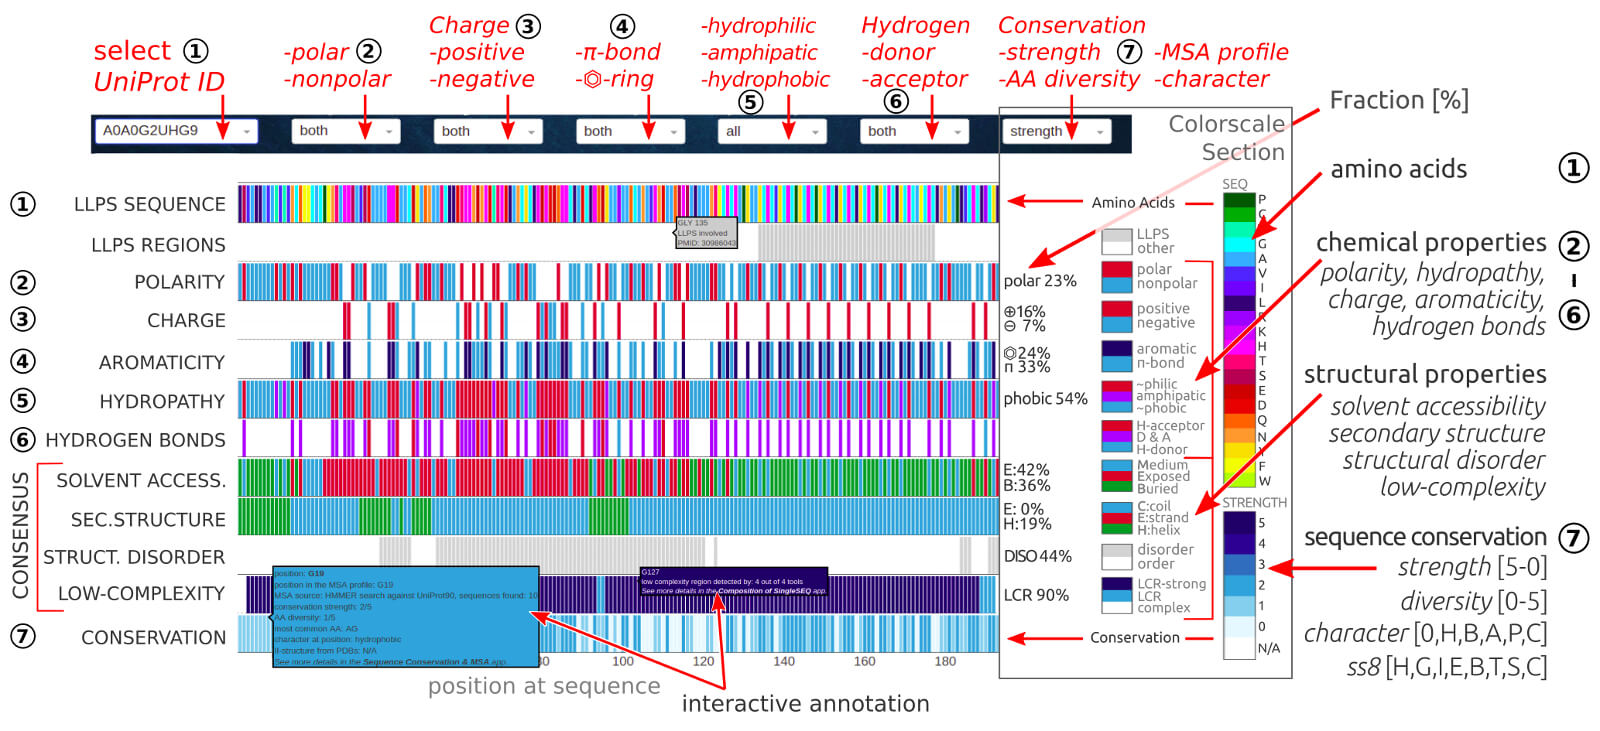
The application allows comparing all key properties for a given LLPS amino acids sequence all within a single chart. Overview of all parameters in one place
helps to identify key residues or short regions that may play a crucial role in LLPS behavior or other functional mechanisms.
0) Dropdown options. The user may select the LLPS sequence by its UniProtID. The following dropdowns allows selecting the displayed patterns of available properties:
2nd POLARITY (polar, nonpolar, both), 3rd CHARGE (positive, negative, both), 4th π-ELECTRON SYSTEM (aromatic ring, other π-bond, both),
5th HYDROPATHICITY (hydrophobic, amphipatic, hydrophilic), 6th HYDROGEN BONDS (donor, acceptor, donor & acceptor),
7thEVOLUTIONARY CONTEXT (conservation strength, conservation character, AA diversity, MSA profile, PDBs-based secondary structure).
1) The first row is the input sequence colored by amino acid composition. The interactive annotation per position at sequence includes residue index and amino acid type.
2) The second row shows regions experimentally confirmed to be crucial for phase separation.
3) The third row contains a binary pattern (blue-white) of polar residues (Ser, Thr, Tyr, Gln, Asn, Cys, Met) in the query sequence. The number on the right indicates the
percentage content of polar residues.
4) The fourth row contains a ternary pattern (blue-navy-white) of charged residues in the query sequence: positive charge (His, Lys, Arg) is marked in blue,
while the negative charge (Glu, Asp) is marked in navy. The number on the right indicates the percentage content of all charged residues.
5) The fifth row contains the ternary pattern (blue-navy-white) of aromatic residues (Phe, Tyr, Trp, His) marked in navy and other π-system containing residues
(Arg, Asn, Asp, Gln, Glu, Gly*) marked in blue. The number on the right indicates the percentage content of aromatic residues.
6) The sixth row contains a hydropathy pattern (blue-purple-red) split between hydrophobic (Gly, Ala, Val, Ile, Leu, Pro, Phe), amphipatic (Trp, Tyr, Met, Cys),
and hydrophilic (Arg, Asn, Asp, Gln, Glu, His, Ser, Thr, Cys) residues in the query sequence. The number on the right indicates the percentage content of
hydrophobic residues. Using 5th dropdown, user can also display hydropathy profile defined by Kyte-Doolittle scale.
7) The seventh row shows available donor (blue), acceptors (red) of hydrogen bonds. The residues with donor-acceptor properties are highlighted in purple.
8) The eighth row contains the consensus of solvent accessibility (SA) assignment provided in 3-state notation (B - buried, marked in green; E - exposed, marked in
red; M - medium, marked in blue) and predicted by several state-of-the-art methods (learn more from SOLVENT ACCESSIBILITY section of the documentation). The number on the
right indicates the percentage of content of buried residues.
9) The ninth row contains the consensus of secondary structure (SS3) assignment provided in 3-state notation (H - helical, marked in green; E - extended, marked in red;
C - coil, marked in blue) and predicted by several state-of-the-art methods (learn more from SECONDARY STRUCTURE section of the documentation). The number on the right
indicates the percentage of content residues that are assigned to the secondary structure element (helix or strand).
10) The tenth row contains the consensus of structural disorder (DISO) predicted by several state-of-the-art methods (learn more from STRUCTURAL DISORDER section of
the documentation). The number on the right indicates the percentage content of disordered residues.
11) The eleventh row contains the consensus of low-complexity regions detected by several state-of-the-art methods (learn more from AA COMPOSITION & LCR section of
the documentation). The number on the right indicates the percentage content of residues located within the low-complexity regions.
12) The twelfth row contains the evolutionary context of sequence conservation. The user can select among various measures provided in the 7th dropdown, i.e.:
• MSA profile, is the consensus sequence obtained from the profile of multiple sequence alignment. The positions being identical with the query sequence
are marked in gray, the positions differing in white.
• attribute describes the chemical nature of the most common amino acids at a given position in the multiple sequence alignment. The defined attributes include:
polar (magenta), charge (dark-red), π-system (orange), aromatic (yellow), hydrophobic (navy), other (G or P, blue).
• diversity define the number of various amino acids detected at a given position in the alignment - the value of this parameter is a discrete number
in the range 0-5 (0 - single AA, 1 - two AA, 2 - three AA, 3 - four AA, 4 - five or six AA, 5 – 7 and more AA). The interactive annotation includes an index
at the sequence, diversity value, and list of corresponding amino acid types at a given position in the alignment.
• strength is a parameter describing the degree of conservation (in the range 0-5: 0 - not conserved, 5 - highly conserved) derived from the results of
hmmlogo (included in HMMER3.3 package) calculations.
• II-structure shows the assignment of secondary structure elements in 8-letter notation, derived from the known PDB structures of sequences in the Pfam seed-MSA.
*Attribute, strength, and diversity are the newly designed (for the purpose of this work) three parameters related to MSA calculation that characterize the evolutionary
conservation of the query sequence. Diversity and strength parameters use the same discrete range while reversed color scales, so the visual interpretations of these two rows is as simple as the meaning
of the darkest bars (navy) that correspond to the highest conservation and lowest diversity (conserved position in alignment and type of amino acid). The quick analysis
of such position, especially when the query sequence at a given point is different (i.e. consensus bar is white) or deleted (sequence bar is gray), helps to detect the
sensitive regions in the sequence that play a key role in the interactions important for structural stability or biological activity.
Learn more about MSA in the SEQUENCE CONSERVATION section of the documentation.
Each position in the sequence in a particular row of the graph is annotated interactively.
The below figure shows the overview result sub-page, which consists of the MSA-based sequence conservation description for a given LLPS sequence.
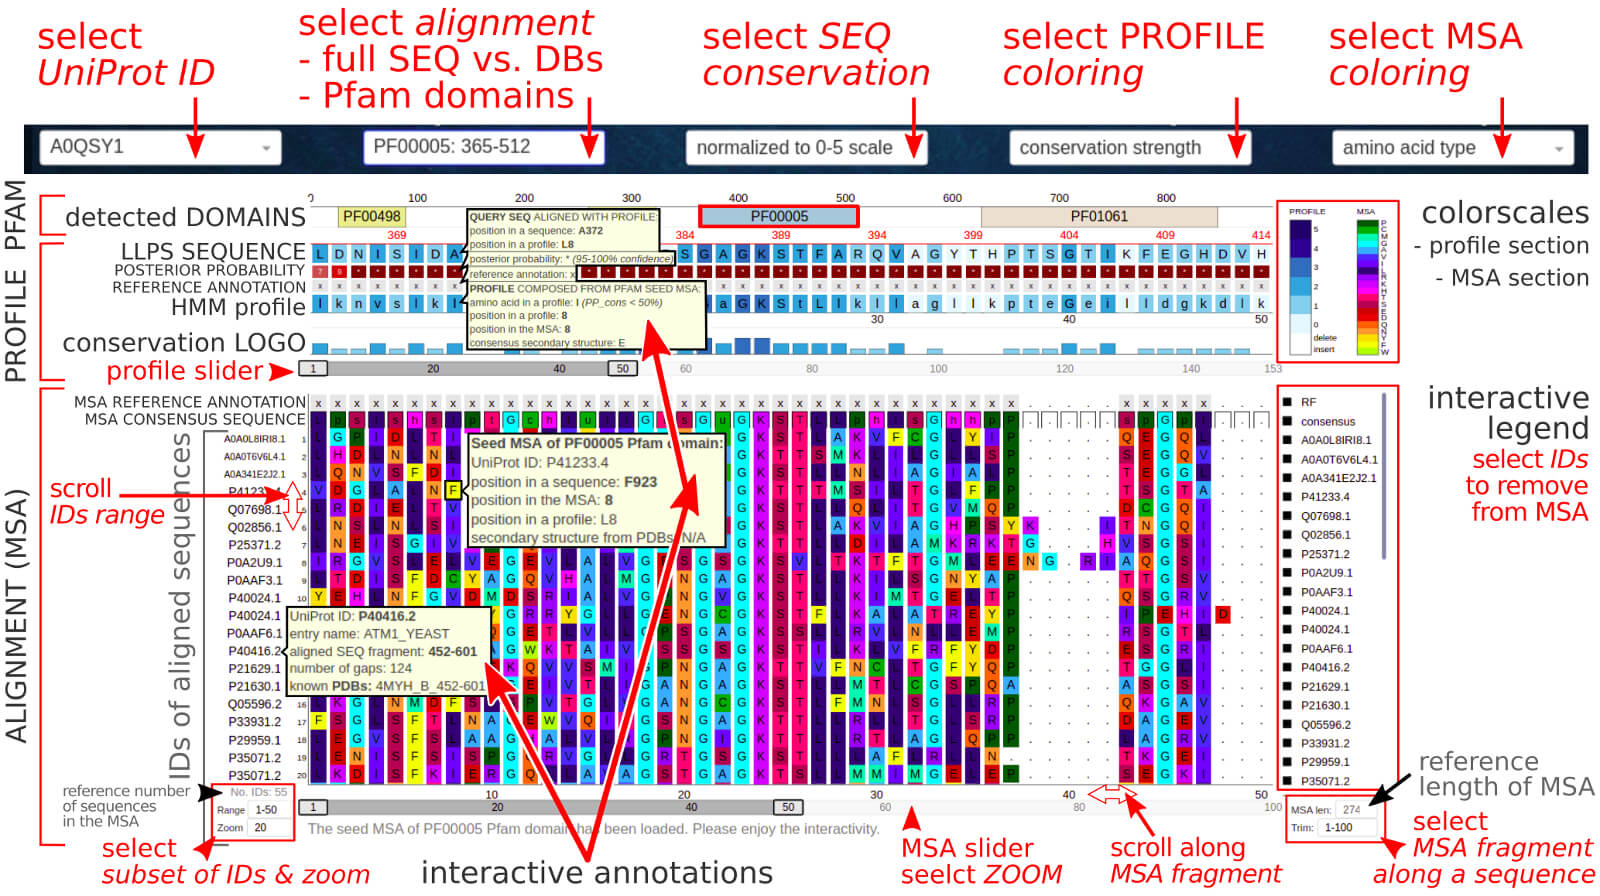
The Sequence Conservation section contains the Multiple Sequence Alignment (MSA) of a query LLPS sequence against sequences selected from
UniProt subsets (SwissProt, UniRef50, or UniRef90),
the consensus (profile) sequence, and evolutionary conservation.
0) Dropdown options. The user may select the LLPS sequence by its UniProtID. The second dropdown allows selecting the pre-calculated MSA variant for the full-length
protein sequence or particular functional domain, if such was detected. The third dropdown contains parameters that can provide some context of the level of evolutionary
conservation. The two other dropdowns allow selecting the color scales for profile and MSA sections, respectively.
MSA section
MSA section contains aligned protein sequences colored by the chemical character of amino acid and sorted by E-value (score is also provided). Each sequence is
annotated interactively by entry name, gene, and organism; target sequence fragment aligned to the query; number of gaps in the MSA; E-value and score;
mean posterior probability (alignment confidence). Each position in the sequence is annotated interactively by index at the sequence, the MSA, and consensus profile;
posterior probability; assigned secondary structure type (if PDBs are known).
Since the MSA is usually large, the displayed fragment is controlled on the fly by a slider and input boxes where the user can define the list of the displayed sequences
(IDs) and trim the MSA for the fragment of interest (the number of displayed points [length of ID range x length of MSA trim range] should be lower than 5000
for a reasonable time of the app loading).
The multiple sequence alignment was produced by using the HMMER3.3
method (phmmer + hmmalign) to search the selected sequence database (SwissProt, UniRef50, UniRef90).
The sequence E-value is the measure of statistical significance, i.e. the expectation of finding that sequence by random chance or the expected number
of false positives (nonhomologous sequences). The lower the E-value, the more significant the hit (here, the sequences with ≤ 10−3 or so were considered to
be significant hits). The HMMER E-value is based on the sequence bit score, which is the log-odds score for the complete sequence and doesn’t depend
on the size of the sequence database (only on the profile and the target sequence).
The profile section
The consensus profile was prepared by using the efficient HMMER3.3
method (hmmbuild) that employs a probabilistic hidden Markov model (HMM) with setting position-specific gap and insertion scores.
The profile captures important information about the degree of conservation at various positions in the multiple alignments. The used colors correspond to
the chemical character of amino acid: yellow – aromatic (F, Y, W), orange – acidic or negatively charged (D, E, N, Q), dark-red – hydroxyl-containing (S, T),
magenta – positively charged (K, R, H), navy – glycine, purple – hydrophobic (A, V, L, I), sulfur-containing (C, M), gray – proline, white – gap.
The conservation level, in the discrete range from 0 to 5, was assigned per position based on results returned from HMMER3.3
hmmlogo tool. This section is annotated by consensus (profile) sequence and the most common amino acid variants at the position.
The Pfam domain section
The Pfam protein families were detected via Pfam search and for each domain, the Pfam seed MSA is available.
Some LLPS proteins are composed of one or more well-known domains. The identification of these functional regions alongside regions of low complexity or disorder
can provide insights into the regulatory role of phase separation.
A multiple sequence alignment (MSA) is a sequence alignment of three or more biological sequences - here we analyzed the protein sequences composed of amino acids.
Alignment is matching different sequences from regions which have more similarity with each other while the multiple sequence alignment tries to minimize the number
of gaps (deletions/insertions) and produce a compact alignment that may be used to build the consensus profile (amino acids at each position in the alignment are
scored according to the frequency with which they occur). The position-specific scoring systems allow determining the evolutionary conservation of protein sequences
at the level of individual amino acids. The conservation strength may be a consequence of the functional, structural, or evolutionary importance of the region in the
sequence.
In general, MSA is produced by an automatic method that maximizes scores and correctness of alignments. The most widely used approaches to MSA uses a heuristic search
(progressive technique or iterative methods), the optimal consensus of various evolution models, Hidden Markov models, or phylogeny-aware methods. The MSA available in the
BIAPSS database was prepared by using an efficient
HMMER3.3
method that employs a probabilistic hidden Markov model (HMM). HMMER makes a probabilistic profile of the query sequence that assigns a position-specific scoring
system for substitutions, insertions, and deletions. Compared to BLAST-based searches, that method is significantly more accurate (detect also the remote homologs)
and similarly fast for protein search.
The below figure shows the overview result sub-page, which consists of a sequence-based prediction of the secondary structure elements for a given LLPS sequence.
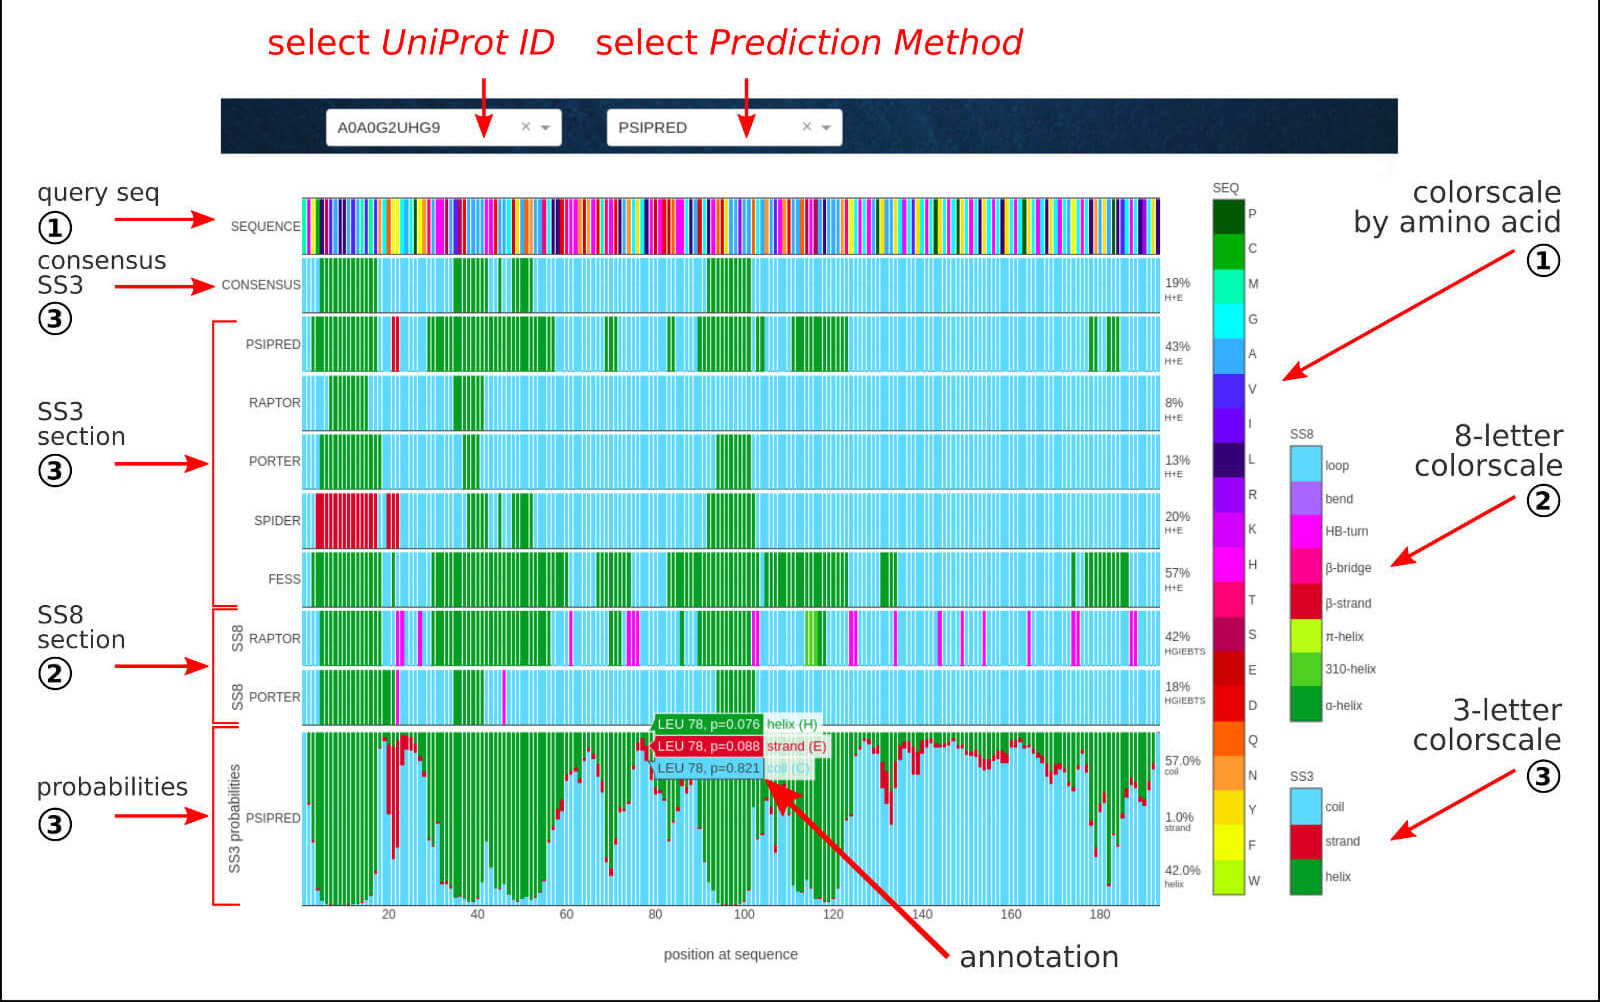
The Secondary Structure section contains the sequence-based predictions of binary assignment of secondary structure elements in 3-state notation (SS3):
H - helix, E - strand, C - coil
and/or 8-state notation (SS8):
H - α-helix, G - 310-helix, I - π-helix, E - β-strand, B - β-bridge, T - HB-turn, S - bend, C/L - loop.
The agreed outcome in SS3 notation of 5 well-established methods:
PSIPRED,
RAPTOR-X,
PORTER-5,
SPIDER-3,
FESS
results in consensus secondary structure assignment. For the selected method, in the probabilities section, the detailed fractions of each type of SS3 elements are provided
per position in the protein sequence. The interactive annotations include residue index, amino acid type, and SS3 fractions.
The raw data (in a psipred, ss2, format) for all the methods is available to download for further analysis.
The secondary structure is a spatial arrangement of short, containing up to 30 consecutive amino acid fragments of the polypeptide chain into one of the known secondary structure
elements: helical (α, 310, π), extended (β-strand, β-bridge, HB-turn, bend), or disordered (coil, loop). Due to the local character of the geometric order, various
elements of the secondary structure may be present in a single polypeptide chain. The appearance of regions taking a strictly defined shape in space is conditioned by the
presence of a series of consecutive amino acid residues, which take periodically repeatable values of Phi and Psi angles in the protein main chain.
It is the pattern and sequence of amino acids involved in the intramolecular hydrogen bond interactions that determine the formation of spatially and energetically
stable conformation of a particular secondary structure.
The below figure shows the overview result sub-page, which consists of a sequence-based prediction of the solvent accessibility assignment for a given LLPS sequence.
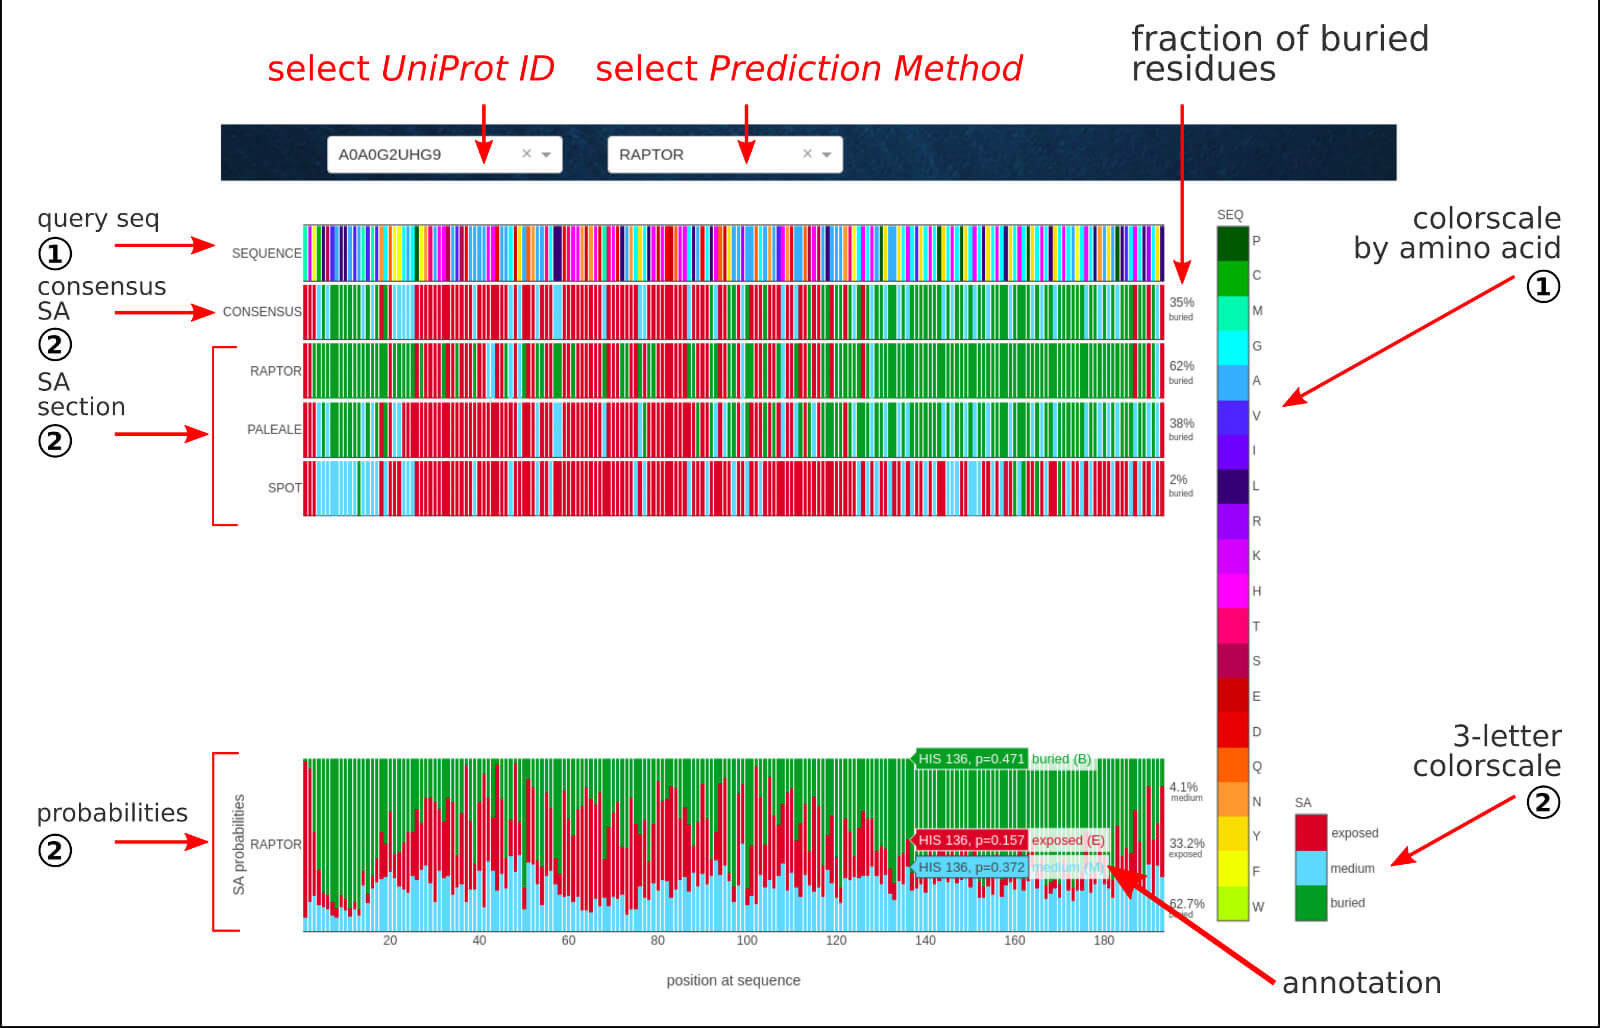
The Solvent Accessibility section contains the sequence-based predictions of binary assignment of solvent accessibility in 3-state notation (ACC):
B - buried, E - exposed, M - medium.
The agreed outcome in the 3-state notation of 3 well-established methods:
RAPTOR-X,
PaleAle5,
SPOT-1D
results in consensus solvent accessibility assignment. For the selected method, in the probabilities section, the detailed fractions of each type of ACC elements are provided
per position in the protein sequence. The interactive annotations include residue index, amino acid type, and ACC fractions.
The raw data for all the methods is available to download for further analysis.
Solvent accessibility is a measure of hydrophobic stabilization, usually defined as the accessible surface area (ASA) or solvent-accessible surface area (SASA) and
described in units of square Ångstroms. The solvent accessibility of protein residues is one of the driving forces (hydrophobic effect) of protein folding as it is
related to the spatial arrangement and packing of the protein. Thus, the ACC parameter describes the tendency of residues to be buried in the interior
of the protein or to be exposed to the solvent.
The below figure shows the overview result sub-page, which consists of a sequence-based prediction of the structural disorder of a given LLPS sequence.
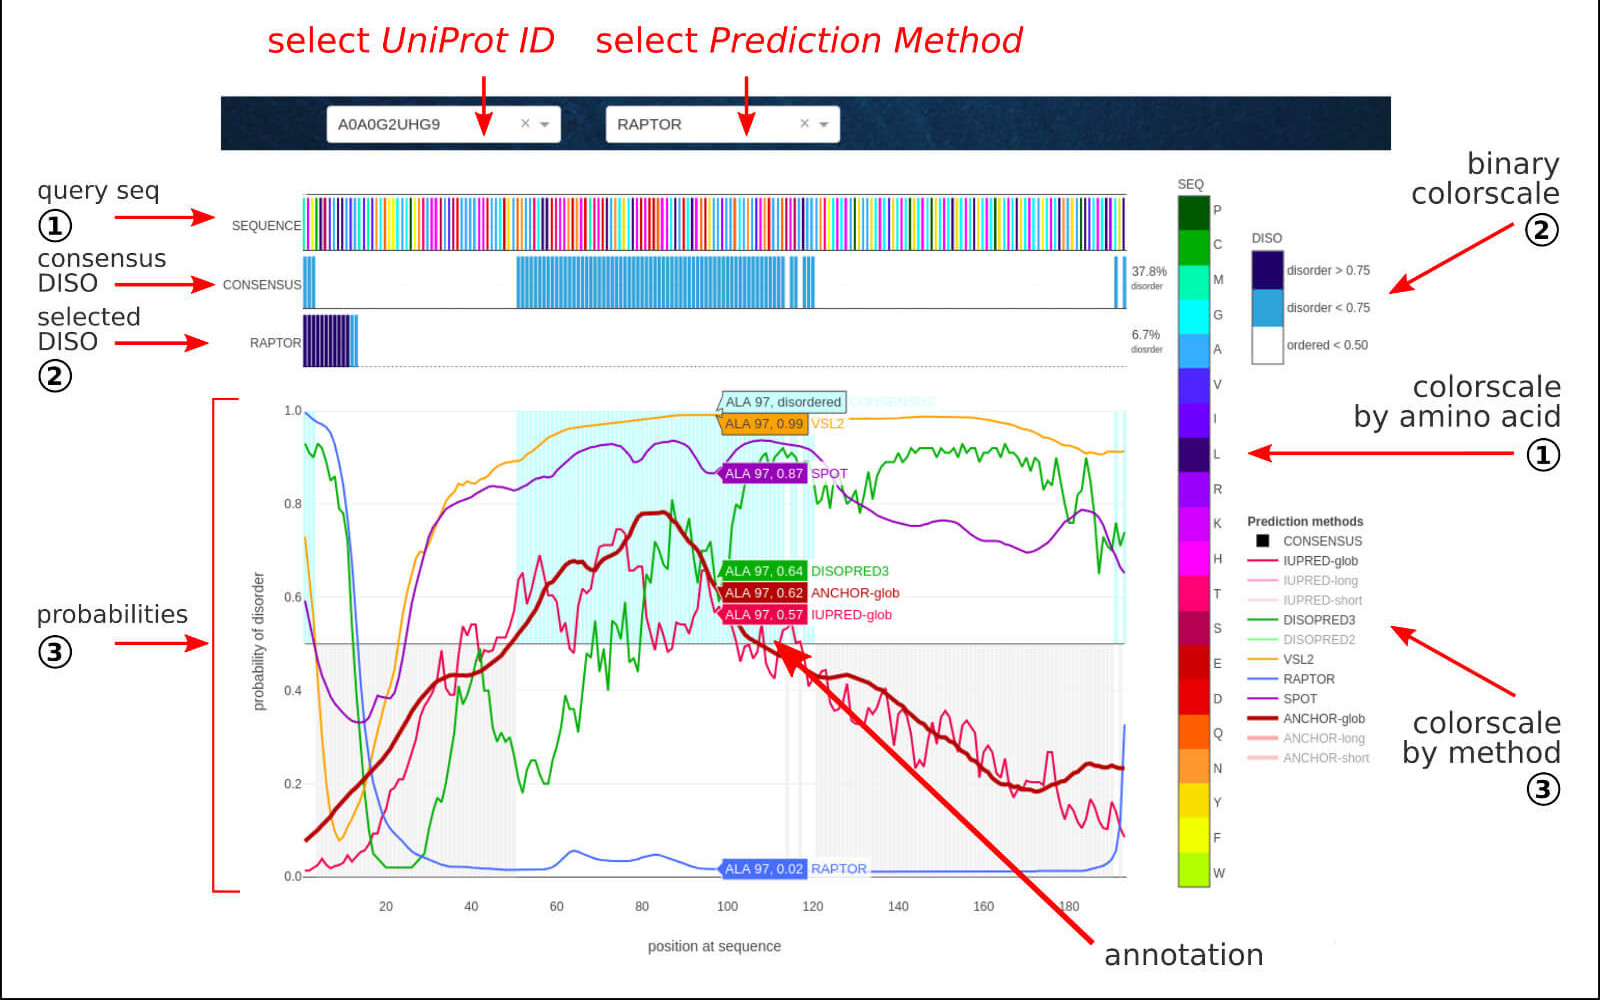
The Structural Disorder section contains the sequence-based predictions of disordered protein regions provided as a binary assignment at a given position in
the sequence (DISO: 0 for p<0.5, 1 for p>0.5).
The agreed outcome of 6 well-established methods:
RAPTOR-X,
IUPred2A (glob, short, long),
SPOT-Disorder,
DISOPRED2/DISOPRED3,
VSL2,
PONDR-FIT/PONDR-VLXT
results in consensus disordered regions assignment. The ANCHOR method was used for predicting protein binding regions in disordered fragments.
For all methods, the detailed probability of disorder is provided per position in the protein sequence. The interactive legend on the right allows displaying
customized results. The automatic annotations include residue index, amino acid type, and disorder probability value.
The raw data for all the methods is available to download for further analysis.
Structural disorder of protein is the lack of fixed or ordered three-dimensional structure in the wide range from fully unstructured to partially structured.
Such proteins are usually called the intrinsically disordered proteins (IDP) that contain intrinsically disordered regions (IDR) or are fully disordered.
The IDPs are highly flexible that facilitates the different conformational requirements for interacting with other molecules. Some IDPs can adopt a fixed
three-dimensional structure after binding. The IDRs are often correlated with amino acid composition characterized by a low content of bulky hydrophobic amino acids
and a high proportion of polar and charged amino acids that cause electrostatic repulsion and prevent the burial of the hydrophobic core and structural stability.
The below figure shows the overview result sub-page, which consists of a sequence-based prediction of the contact map for the given LLPS sequence.
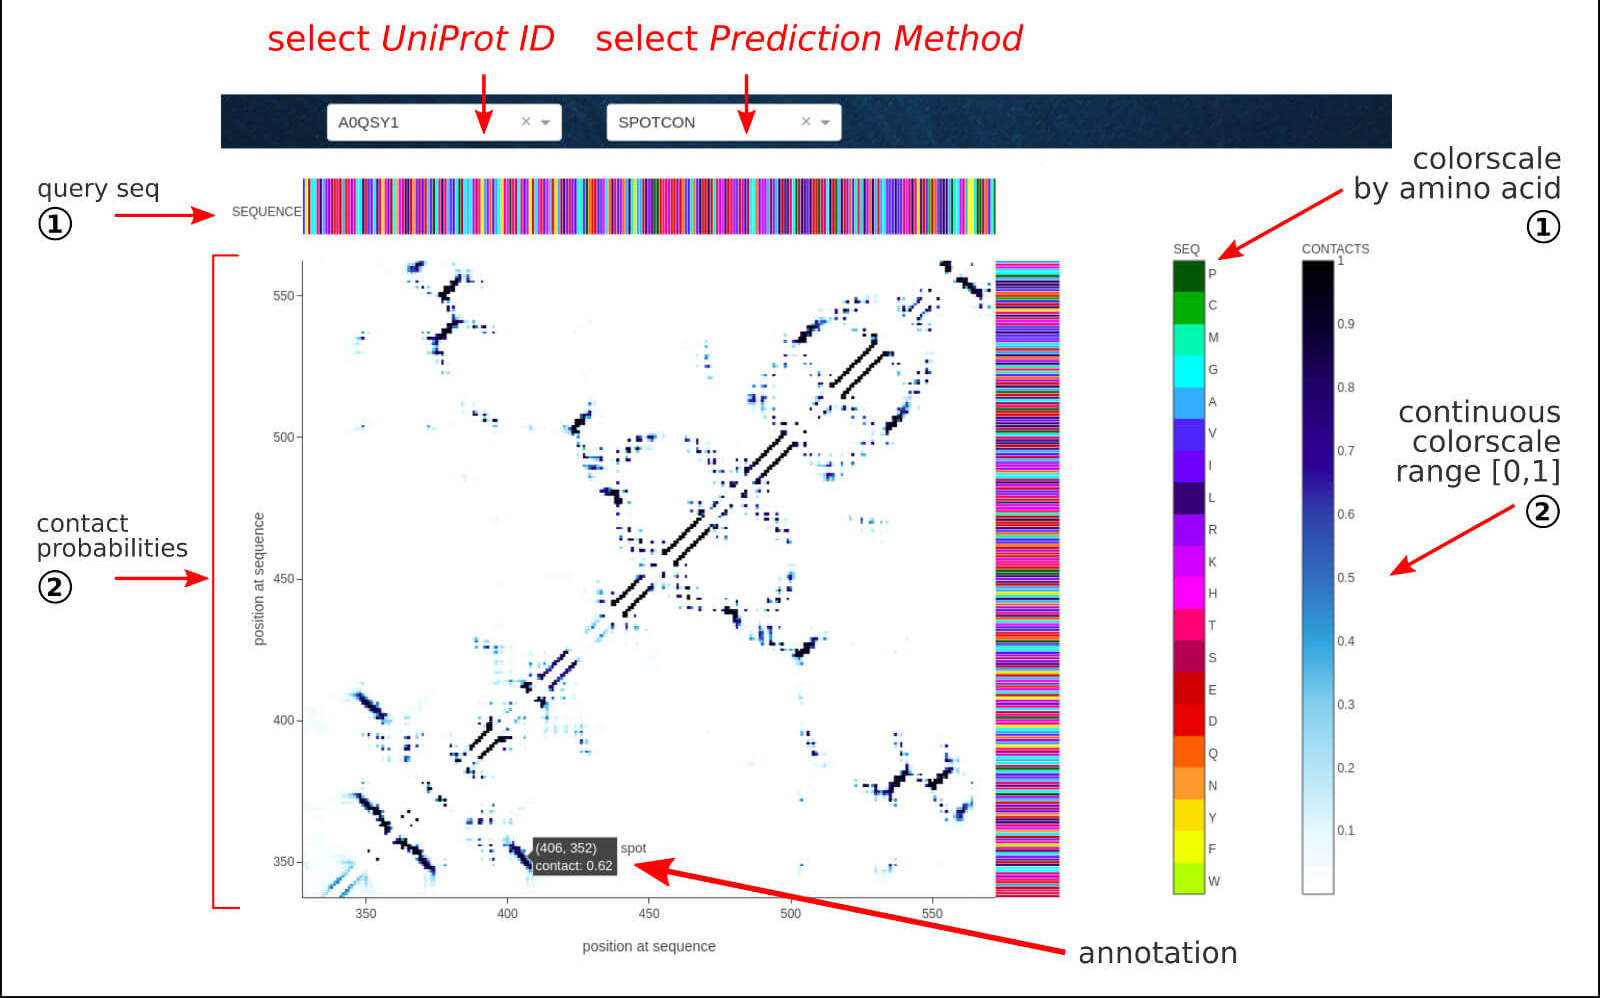
The Contact Map section contains the sequence-based predictions of contact probabilities as a two-dimensional matrix (CON). The pair of residues is considered as
being in spatial contact for probability value above 0.5.
The outcome of 3 well-established methods is available:
RAPTOR-X,
RESPRE,
SPOT-Contact.
The interactive annotations include residue index, amino acid type, and contact probability.
The raw data for all the methods is available to download for further analysis.
Contact maps provide a more reduced representation of a protein structure using a binary two-dimensional matrix of distances between all possible amino acid
residue pairs. The contact number of protein residues limits the possibilities of protein conformations and helps to encode a three-dimensional structure.
The sequence-based prediction of contacts is feasible with the availability of high numbers of sequences that contain coupled (coevolving) residue pairs.
The below figure shows the overview result sub-page, which presents the short linear motif (SLiMs) detected in the given LLPS sequence.
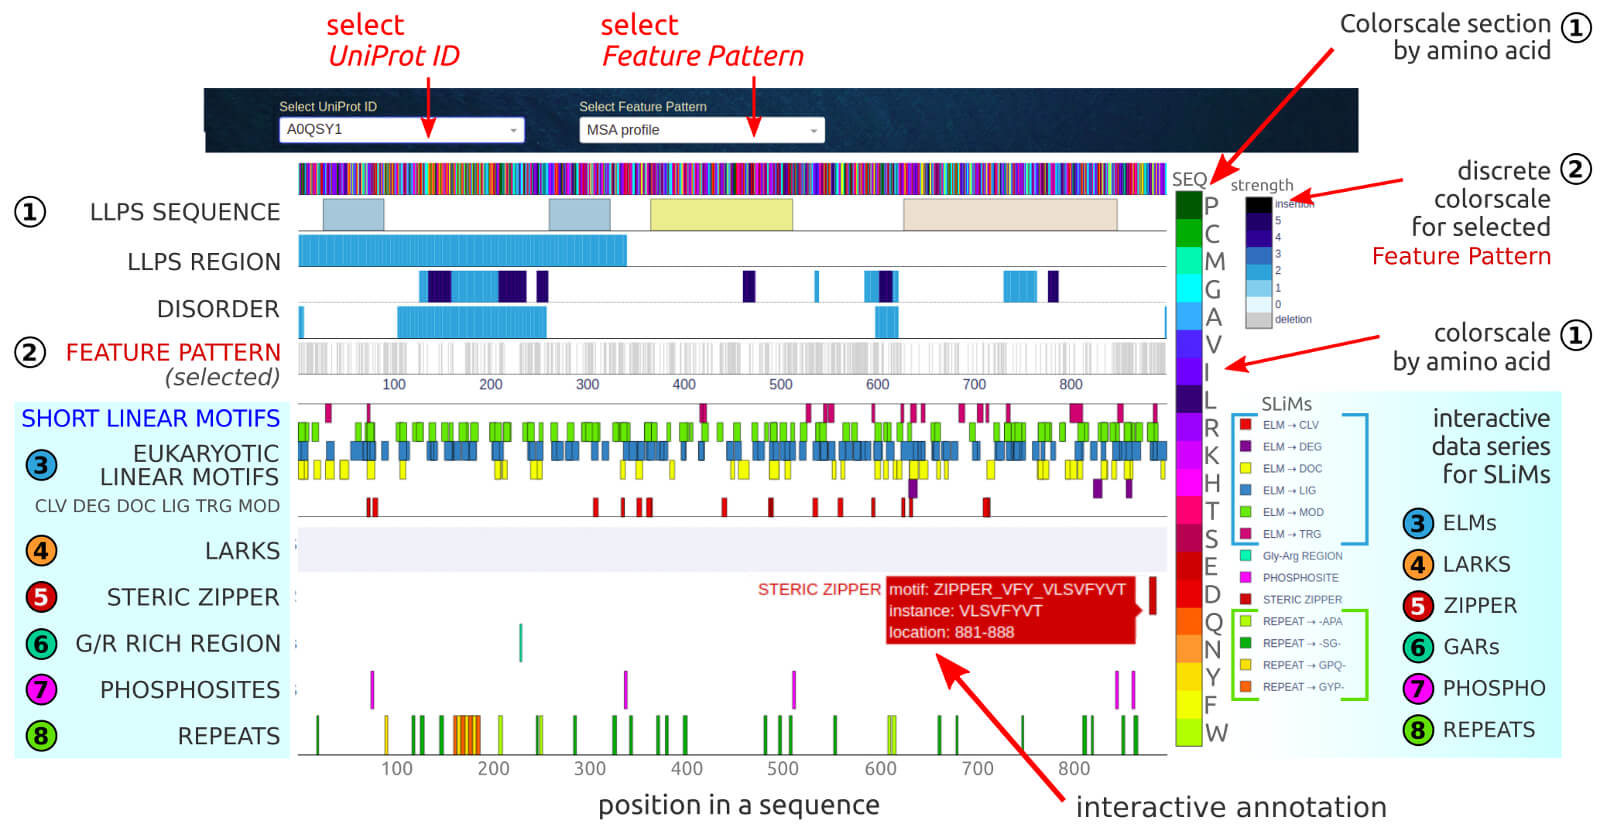
The query LLPS sequence may be selected by the user in the first dropdown (UniProt ID). The second dropdown (Feature Pattern) allows selecting the
customized physicochemical or structural properties or evolutionary context that will be displayed as a background of the detected domains, motifs and repeats.
The available feature patterns include:
• MSA profile
• SEQ conservation: strength, character, AA diversity
• polar / charge / aromatic / hydrophobic
• secondary structure
• solvent accessibility
The motif location may be correlated to basic characteristics of a given LLPS sequence, that are provided in the top five rows in the chart:
1) the amino acid sequence provided in the color scale
2) the detected Pfam domains (interactive annotation provides domain accession number and scores)
3) the LLPS regions with experimental evidence (interactive annotation provides PMID)
4) the consensus of sequence-based predictions of structural disorder
5) the selected feature pattern customized via the third dropdown (see available options in the picture).
The SHORT MOTIFS (sequential and structural) section of the app presents short stretches of protein sequence divided into six main groups:
• ELMs, the Eukaryotic Linear Motifs experimentally validated in eukaryotic cells;
• LARKS, the low-complexity aromatic-rich kinked segments;
• steric zipper, a structural motif of the dry interface formed via van der Waals interactions and hydrogen bonds;
• GARs, Glycine-Arginine Rich Regions;
• PTMs, the post-translational modification sites (S--D/S--E motifs for phosphosites);
• repeats, short fragments having the same or similar sequence motifs that are repeated several times along the sequence.
The detailed information (location, motif's instance, value) is displayed on interactive labels when hovering over a point in the chart.
The results can be downloaded as a PNG image in the app or text file from the Download tab.
Known Linear Motifs (SLiMs) are short fragments along the sequence that are generally evolutionary conserved and often situated in intrinsically
disordered regions. Their unique feature is structural flexibility since the secondary structure is usually induced when interacting with a structured partner.
SLiMs are involved in regulatory processes, signal transduction, protein-protein interaction, and recognition of other intrinsically disordered regions, RNA or lipids.
The categorized subsets of data available in the BIAPSS resources can be downloaded as CSV zipped files from the
DOWNLOAD subpage. That section explains how to download data packages and provides
a detailed description of the content of each file and a full list of third-party tools involved in the derivation of data.
The corresponding customized charts of the comprehensive statistical analysis can be downloaded as high-resolution PNG images from the interactive applications in
MultiSEQ and SingleSEQ
subpages. The images are in professional publication quality and can be easily used for scientific purposes, assuming the BIAPSS Terms of Use are met
(for more information, please visit the LICENSE & FAQ tab).
BIAPSS services
Updated once a year BIAPSS resources are composed of:
• the robust database of liquid-liquid phase separating protein sequences being a non-redundant, joined, and reviewed set of entries deposited in primary databases:
PhaSePro, LLPSDB, PhaSepDB, and drLLPS,
• the set of web services being the comprehensive bioinformatic analyses on known LLPS sequences provided in the form of interactive and customizable applications,
• the repository of initially precomputed, downloadable, and easy-to-use multiple sequence alignments and predictions of one- and two-dimensional biophysical properties of protein sequences.
The further development of BIAPSS services involves building a meta-server to analyze customized sequences provided by the user, including LLPS prediction and/or design.
For this purpose, please visit our website to follow the new features of the BIAPSS services.
CITE:
1.
BIAPSS - Bioinformatic analysis of liquid-liquid phase separation protein sequences. A.E. Badaczewska-Dawid, V.N. Uversky, D.A. Potoyan,
submitted, 2021.
2. A.E. Badaczewska-Dawid, V.N. Uversky, D.A. Potoyan, Integrative assembling of phase separation signals derived from sequence-based analysis, in preparation, 2021
Phase Separation Predictors
PSPredictor is a sequence-based tool for query and prediction of potential phase separation proteins.
The tool uses the machine learning based PSP prediction model, which returns a float score in the range 0-1 that determines whether a query protein shows phase-separating behavior.
PSPredictor is available as a web server only but it allows for the parallel prediction of PS for 100 proteins,
so it is accessible for large-scale calculations as well.
CITE:
Prediction of liquid-liquid phase separation proteins using machine learning. T. Sun, Q. Li, Y. Xu, Z. Zhang, L. Lai, J. Pei.,
in press, 2019.
Low-Complexity Regions (LCRs)
SEG is a sequence-based tool for detecting LCRs within protein sequences.
SEG identifies the LCR, and then performs local optimization by masking with Xs the low-complexity regions within the protein sequence.
SEG is available as a command-line tool.
CITE:
Statistics of local complexity in amino acid sequence and sequence database. Wootton, J.C. and Federhen, S.,
Comput. Chem. 17149–163, 1993.
fLPS is a sequence-based tool that rapidly annotates compositionally-biased regions
in biological sequences. The algorithm picks out low probability subsequences (LPSs) through a process of probability minimization. fLPS detects both, poly-X regions
enriched with single amino acid (when there are many residues of a single type in a short span) and XYZ-rich regions enriched with multiple amino acids (when two or more
residue types predominate in a short span).
fLPS is available as a command-line tool.
CITE:
fLPS: Fast discovery of compositional biases for the protein universe. Harrison, P.M., BMC Bioinformatics, 18(1):476, 2017.
CAST2 is an algorithm for low-complexity region detection and selective masking.
The algorithm is based on multiple-pass Smith-Waterman comparison of the query sequence against twenty homopolymers with infinite gap penalties.
The output of the algorithm is both the masked query sequence for further analysis, e.g. database searches, as well as the regions of low complexity.
CAST2 is available as a web server.
CITE:
CAST: an iterative algorithm for the complexity analysis of sequence tracts. Promponas, V.J. et al., Bioinformatics, 16(10), 915–922, 2000.
SIMPLE is an algorithm for low-complexity region detection in the biologic sequences.
The algorithm returns the low-complexity-rich motifs that accumulated high simplicity scores.
SIMPLE is available as a command-line tool.
CITE:
Detecting cryptically simple protein sequences using the SIMPLE algorithm. Alba, M.M. et al., Bioinformatics, 18(5), 672–678, 2002.
Multiple Sequence Alignment
HMMER3.3 is used for searching sequence databases for sequence homologs, for making
sequence alignments, building profiles from input multiple alignments, producing a conservation logo graphic from a profile, and many more.
It implements methods using probabilistic hidden Markov models (profile HMMs). HMMER can be downloaded and installed as a
command-line tool,
and now it is also accessible as a web server.
CITE:
1.
Challenges in Homology Search: HMMER3 and Convergent Evolution of Coiled-Coil Regions. J. Mistry, R. D. Finn, S. R. Eddy, A. Bateman, M. Punta.
Nucleic Acids Research, 41:e121, 2013.
2.
HMMER Web Server: Interactive Sequence Similarity Searching. R. D. Finn, J. Clements, S. R. Eddy. Nucleic Acids Research, 39:W29-37, 2011.
3.
A New Generation of Homology Search Tools Based on Probabilistic Inference. S. R. Eddy. Genome Inform., 23:205-211, 2009.
Secondary structure prediction (sequence-based)
PSIPRED is a secondary structure prediction method,
incorporating two feed-forward neural networks that perform an analysis of output obtained from PSI-BLAST. PSIPRED can be downloaded and installed as a
command-line tool,
and it is also accessible as a web server.
CITE:
1.
The PSIPRED Protein Analysis Workbench: 20 years on. Buchan DWA, Jones DT. Nucleic Acids Research, 47(W1):W402-407, 2019.
2.
Protein secondary structure prediction based on position-specific scoring matrices. Jones DT. J. Mol. Biol., 292: 195-202, 1999.
RAPTOR-X Property Prediction predicts one-dimensional
properties of protein without using templates, including secondary structure (3- and 8- state notation), solvent accessibility, and disordered regions.
RAPTOR-X can be downloaded and installed as a
command-line tool,
and it is also accessible as a web server.
CITE:
Protein 8-class secondary structure prediction using conditional neural fields. Wang Z, Zhao F, Peng J, Xu J. Proteomics, 11(19):3786-92, 2011.
PORTER-5 is a secondary structure prediction method
incorporating bidirectional recurrent neural networks and Convolutional Neural Networks. The approach uses both psiblast and HHblits on the UniProt database and returns
secondary structure assignment in 3- and 8-state notation. PORTER-5 can be downloaded and installed as a
command-line tool,
and it is also accessible as a web server.
CITE:
1.
Deeper Profiles and Cascaded Recurrent and Convolutional Neural Networks for state-of-the-art Protein Secondary Structure Prediction.
M.Torrisi, M.Kaleel, G.Pollastri. Scientific Reports, 9: 12374, 2019.
2.
Porter 5: state-of-the-art ab initio prediction of protein secondary structure in 3 and 8 classes.
M.Torrisi, M.Kaleel, G.Pollastri. in press, 2019.
SPIDER-3 is a method incorporating bidirectional recurrent neural
networks and resulting in 3-state secondary structure prediction.
SPIDER-3 can be downloaded and installed as a
command-line tool,
and it is also accessible as a web server.
CITE:
Single-sequence-based prediction of protein secondary structures and solvent accessibility by deep whole-sequence learning.
R. Heffernan, K. Paliwal, J. Lyons, J. Singh, Y. Yang, and Y. Zhou. J. Computational Chemistry, 39, 2210-2216, 2018.
FESS uses a single-sequence neural network architecture to predict
secondary structure elements, and compared to ESpritz provides a similar speed and accuracy. FESS can be downloaded and installed as a
command-line tool,
and it is also accessible as a web server.
CITE:
FELLS: Fast Estimator of Latent Local Structure.
Piovesan D, Walsh I, Minervini G and Tosatto SCE. Bioinformatics, 33(12): 1889–1891, 2017.
Solvent Accessibility prediction (sequence-based)
RAPTOR-X Property Prediction predicts one-dimensional
properties of protein without using templates, including secondary structure (3- and 8- state notation), solvent accessibility, and disordered regions.
RAPTOR-X can be downloaded and installed as a
command-line tool,
and it is also accessible as a web server.
CITE:
Protein 8-class secondary structure prediction using conditional neural fields. Wang Z, Zhao F, Peng J, Xu J. Proteomics, 11(19):3786-92, 2011.
PaleAle5.0 predicts relative solvent accessibility (RSA)
of amino acids within a protein (4 classes: B - very buried, b - 4-25% exposed, e - 25-50% exposed, E - very exposed) using bidirectional recurrent neural networks
and convolutional layers that include information from long-range interactions. PaleAle5.0 can be downloaded and installed as a
command-line tool
and it is also accessible as a web server,.
CITE:
PaleAle 5.0: prediction of protein relative solvent accessibility by deep learning. M.Kaleel, M.Torrisi, C.Mooney, G.Pollastri. Amino Acids, 51:1289–1296, 2019.
SPOT-1D predicts one-dimensional properties of protein using
an ensemble of recurrent and residual convolutional neural networks, including secondary structure (3-state notation), backbone angles, solvent accessibility, and contact numbers.
SPOT-1D can be downloaded and installed as a
command-line tool
and it is also accessible as a web server,.
CITE:
Improving prediction of protein secondary structure, backbone angles, solvent accessibility, and contact numbers by using predicted contact maps and an ensemble
of recurrent and residual convolutional neural networks. J. Hanson, K. Paliwal, T. Litfin, Y. Yang, and Y. Zhou. Bioinformatic, 35: 2403–2410, 2019.
Structural Diosrder prediction (sequence-based)
RAPTOR-X Property Prediction predicts one-dimensional
properties of protein without using templates, including secondary structure (3- and 8- state notation), solvent accessibility, and disordered regions.
RAPTOR-X can be downloaded and installed as a
command-line tool
and it is also accessible as a web server,.
CITE:
Protein 8-class secondary structure prediction using conditional neural fields. Wang Z, Zhao F, Peng J, Xu J. Proteomics, 11(19):3786-92, 2011.
IUPred2A is used for context-dependent prediction of disordered protein
regions (depending on the redox state of the environment) using IUPred2 and disordered binding regions using ANCHOR2.
IUPred2A can be downloaded and installed as a
command-line tool
and it is also accessible as a web server,.
CITE:
IUPred2A: context-dependent prediction of protein disorder as a function of redox state and protein binding. B. Mészáros, G. Erdős, Z. Dosztányi.
Nucleic Acids Research, 46(W1):W329-W337, 2018.
DISOPRED3 predicts intrinsically
disordered regions and protein-binding sites within them using a novel SVM based classifier. DISOPRED can be downloaded and installed as a
command-line tool,
and it is also accessible as a web server.
CITE:
DISOPRED3: precise disordered region predictions with annotated protein-binding activity.
D.T. Jones, D. Cozzetto. Bioinformatic, 31(6):857–863, 2015.
SPOT-Disorder2 is used for intrinsic disorder prediction by
employing an ensemble of deep Squeeze-and-Excitation (EDL) residual inception and long short-term memory (LSTM) networks.
SPOT-Disorder can be downloaded and installed as a
command-line tool,
and it is also accessible as a web server.
CITE:
SPOT-Disorder2: Improved Protein Intrinsic Disorder Prediction by Ensembled Deep Learning.
J. Hanson, K. Paliwal, T. Litfin, and Y. Zhou Genomics, Proteomics & Bioinformatics, in press, 2020.
VSL2 is used for prediction of disordered regions of any length
(short ≤ 30 residues and long > 30 residues) by using linear support vector machine (SVM) and moving-average approach to remove occasional misclassifications.
VSL2 can be downloaded and installed as a
command-line tool,
and it is also accessible as a web server.
CITE:
Length-dependent prediction of protein intrinsic disorder.
Peng,K., Radivojac,P., Vucetic,S., Dunker,A.K. and Obradovic,Z. BMC Bioinformatics, 7(1):20, 2006.
PONDR predicts the disordered regions upon single sequences by using
neural network predictors (NNPs) that were trained on non-redundant sets of ordered and disordered sequences. It uses sequence attributes, such as the fractional
composition of particular amino acids, hydropathy, or sequence complexity, taken over windows of 9 to 21 amino acids. When making predictions, NNP outputs are between
0 and 1 and are then smoothed over a sliding window of 9 amino acids. If a residue value exceeds or matches a threshold of 0.5 the residue is considered disordered.
PONDR is available as a general
PONDR webserver, combining various predictors (e.g., VLXT, VL3, or VSL2),
and it is also accessible as a separate PONDR-FIT web server.
CITE:
1.
Prediction of boundaries between intrinsically ordered and disordered protein regions.
Radivojac P, Obradovic Z, Brown CJ, Dunker AK. Pac. Symp. Biocomput. , 8, 216-227, 2003.
2.
PONDR-FIT: A Meta-Predictor of Intrinsically Disordered Amino Acids.
Xue B, Dunbrack RL, Williams RW, Dunker AK, Uversky VN. Biochim Biophys Acta. , 1804(4): 996–1010, 2010.
Contact Map prediction (sequence-based)
RAPTORX-Contact uses an ultra-deep convolutional residual neural network to predict
the contact map and distance matrix without using any templates. RaptorX-Contact was ranked 1st in contact prediction in both CASP12 and CASP13.
RAPTOR-X can be downloaded and installed as a
command-line tool,
and it is also accessible as a web server.
CITE:
Protein 8-class secondary structure prediction using conditional neural fields. Wang Z, Zhao F, Peng J, Xu J. Proteomics, 11(19):3786-92, 2011.
ResPRE is an algorithm for protein residue-residue contact-map
prediction, where the contact models are trained through deep residual convolutional neural networks.
ResPRE can be downloaded and installed as a
command-line tool,
and it is also accessible as a web server.
CITE:
ResPRE: high-accuracy protein contact prediction by coupling precision matrix with deep residual neural networks. Jun Hu, Chengxin Zhang, Dong-Jun Yu, and Yang Zhang. Bioinformatics, 35: 4647-4655, 2019.
SPOT-Contact is a novel protein contact map prediction method by
stacking residual convolutional networks with two-dimensional residual bidirectional recurrent LSTM networks and using both one-dimensional sequence-based and
two-dimensional evolutionary coupling-based information. SPOT-Contact can be downloaded and installed as a
command-line tool
and it is also accessible as a web server.
CITE:
Accurate prediction of protein contact maps by coupling residual two-dimensional bidirectional long short-term memory with convolutional neural networks.
J. Hanson, K. Paliwal, T. Litfin, Y. Yang, and Y. Zhou. Bioinformatic, 34: 4039–4045, 2018.
Identification of known Short Linear Motifs (sequence-based)
ELM, Eukaryotic Linear Motif, is a repository of manually curated experimentally validated short linear motifs
in eukaryotic proteins. The SLiM-related BIAPSS applications use the list of ELMs defined by regular expressions as the keys to search various eucaryotic linear motifs
in known phase separation prone sequences.
CITE:
ELM—the eukaryotic linear motif resource in 2020.
M. Kumar, M. Gouw, S. Michael, H. Sámano-Sánchez, R. Pancsa, J. Glavina, A. Diakogianni, J.A. Valverde, D. Bukirova, J. Čalyševa, N. Palopoli, N.E. Davey,
L.B. Chemes, T.J. Gibson Nucleic Acids Research, 48(D1): D296–D306, 2020.
The SLiM-related BIAPSS applications use regular expressions to code and detect other known short stretches of adjacent amino acids within LLPS protein sequences:
CITE:
1. LARKS motifs:
Atomic structures of low-complexity protein segments reveal kinked β sheets that assemble networks. M.P. Hughes, M.R. Sawaya, D.R. Boyer, L.Goldschmidt,
J.A. Rodriguez, D. Cascio, L. Chong, T. Gonen, D.S. Eisenberg. Science, 359(6376): 698-701, 2018.
2. GAR regions:
RGG/RG Motif Regions in RNA Binding and Phase Separation. A. Chong, R.M. Vernon, J.D. Forman-Kay. J Mol Biol, 430(23):4650-4665, 2018.
3. steric zipper:
The Three-Dimensional Structures of Amyloids. Roland Riek. Cold Spring Harb Perspect Biol., 9(2): a023572, 2017.
4. phosphosites:
The Role of Post-Translational Modifications in the Phase Transitions of Intrinsically Disordered Proteins. I. Owen and F. Shewmaker. Int. J. Mol. Sci., 20, 5501, 2019.
BIAPSS services are provided on the GNU General Public License, which is a free, copyleft license for software and other kinds of works.
BIAPSS is an open-source and open-access resource, available online to anyone. Services are provided free of charge for academic and non-profit users.
The third-party software that was used for the preparation of the input data for some of BIAPSS services will have their own individual license agreements.
It is the responsibility of users to ensure that they do not violate the confidentiality of these license agreements.
BIAPSS database applies the Privacy Policy of Iowa State University as an integral
part of its resources. By using BIAPSS services, you signify your acceptance of this policy. If you have any questions about this policy, practices of the site,
or dealing with the site, please contact us.
Suggested Browsers:
• for Linux/Ubuntu users: Google Chrome, Firefox
• for Windows users: Google Chrome, Firefox, Opera
• for Mac users: Safari
• for mobile devices: the website is dedicated to mobile devices larger than 600x300px and some of its functionality may be limited.
Please CITE the original BIAPSS publication(s) when using any data available on our resources in your publication or web page:
1.
BIAPSS - Bioinformatic analysis of liquid-liquid phase separation protein sequences. A.E. Badaczewska-Dawid, V.N. Uversky, D.A. Potoyan, submitted, 2021.
2. A.E. Badaczewska-Dawid, V.N. Uversky, D.A. Potoyan, Integrative assembling of phase separation signals derived from sequence-based analysis, in preparation, 2021
The BIAPSS website layout (HTML, CSS), backgrounds, and other images (excluding microscopic images) are designed by Aleksandra E. Badaczewska-Dawid
(abadacz@iastate.edu) by using freely available tools: Blender, Inkscape, and Gimp. The copyrights
are reserved. It is possible to use any image in an unchanged form with the obligation to provide the author's name and to cite the selected BIAPSS publication.
In case of the use of an image in the modified form, contact with the author is required for approval. Please, also include the URL that links directly to the BIAPSS source.
The BIAPSS interactive applications are designed by Aleksandra E. Badaczewska-Dawid (abadacz@iastate.edu)
by using the python framework and front-end graphing libraries such as plotly and dash.
Any application allows the user to generate a customized chart, which is downloadable as a publication-quality PNG image. The high-resolution BIAPSS-generated charts and
images can be used free of charge in scientific publications of the users. If you use images or other data downloaded from the site, in addition to citing the BIAPSS,
please also include the specific image credit or data used and the URL that links directly to that information in a manner that will allow a third party to navigate to
the proper location on the BIAPSS site.
The BIAPSS interactive applications use the precomputed data (updated once a year) obtained by using several well-established standalone tools for:
• the HMMER3.3-based Multiple Sequence Alignment (MSA) of a query LLPS sequence against sequences selected from
UniProt subsets (SwissProt, UniRef50 or UniRef90)
and predictions of sequence-based one- and two-dimensional properties such as:
• secondary structure: PSIPRED, RAPTOR-X,
PORTER-5, SPIDER-3, FESS
• solvent accessibility: RAPTOR-X, PaleAle5,
SPOT-1D
• disordered fragments: RAPTOR-X, IUPred2A,
SPOT-Disorder,
DISOPRED2/DISOPRED3,
VSL2, PONDR
• protein binding regions in disordered fragments: ANCHOR
• contact maps: RAPTOR-X, RESPRE,
SPOT-Contact
• liquid-liquid phase-separation: experimental evidences and sequence-based predictions:
PSPredictor web server.
As an active scientific community, we encourage users to browse the TOOLS & REFERENCES tab containing the list of recommended publications for related tools
and to cite them in case the data provided in BIAPSS resources prove useful.
The raw data derived from these standalone tools during the high-performance computing (HPC) on Iowa State University clusters was initially parsed, filtered, and
analyzed by numerous python methods developed by Aleksandra E. Badaczewska-Dawid (abadacz@iastate.edu).
Further development of BIAPSS resources involves an extention to analyze customized sequences provided by the user.
The results of the statistical analysis with the agreed data format (CSV) are publicly available for download in the DOWNLOAD tab.
For the user's convenience, the data has been categorized and stored in zipped folders. Additional deep comparative analysis and consensus of the methods used are available
for user's convenience in the interactive applications in MultiSEQ and
SingleSEQ tabs.
The BIAPSS resources utilize public databases (UniProt) contributed by the community who remain the data owners.
The original data may be subject to rights claimed by third parties. It is the responsibility of users to ensure that their exploitation of the data does not infringe any
of the rights of such third parties.
Some BIAPSS subpages or applications may provide links to other databases and websites
(PhaSePro, PhaSepDB,
LLPSDB, drLLPS,
UniProt, DisProt,
The Human Protein Atlas, Compartments,
PDBe, Swiss-Model Repository,
ModBase, PubMed,
ELM, PONDR,
PSPredictor)
for the convenience of users. BIAPSS is not responsible for the availability or content of these external sites, nor does BIAPSS endorse, warrant, or guarantee the products,
services, or information described or offered at these other websites.
It is the responsibility of the user to examine the copyright and licensing restrictions of linked pages and to secure all necessary permissions.
For assistance with questions or problems regarding BIAPSS resources, contact abadacz@iastate.edu, use the contact form,
or explore the Frequently Asked Questions section provided below.
Q: How do I cite BIAPSS?
Please cite the original BIAPSS publication(s) when using any data available on our resources in your publication or web page:
1.
BIAPSS - Bioinformatic analysis of liquid-liquid phase separation protein sequences. A.E. Badaczewska-Dawid, V.N. Uversky, D.A. Potoyan, submitted, 2021.
2. A.E. Badaczewska-Dawid, V.N. Uversky, D.A. Potoyan, Integrative assembling of phase separation signals derived from sequence-based analysis, in preparation, 2021
Q: Is BIAPSS an open-source project?
Yes, BIAPSS is an open-source project. Please cite BIAPSS if your work has used any of the freely available tools in our resources.
Q: Am I allowed to download BIAPPS resources and use data/apps in my research or to build my own server?
You are allowed to download the BIAPSS repository containing the benchmarked data for all LLPS sequences and use it for your non-profit scientific purposes.
You are also allowed to use downloadable results of all BIAPSS applications, i.e., customized slices of our in-depth bioinformatic analysis as PNG images
in publication quality. Whether you use them in your publication or on your website/blog/server, we ask you to cite the original BIAPSS publication and include
also the URL that links directly to the original source, which will allow a third party to navigate to the proper location on the BIAPSS site. You are not authorized
to copy the code or attach any BIAPSS application as a built-in part of your project without prior contact with the BIAPSS developers (abadacz@iastate.edu).
At the same time, we would like to kindly inform you that we are open to any research cooperation that may bring a breakthrough in the phase separation field.
Q: Can I use graph’s images generated by BIAPSS applications in a publication or outreach?
BIAPSS is an open-source resource, and you are allowed to use generated graphs and data in any way you like under the Terms of Use described in the License & FAQ section.
We ask you to cite BIAPPS reference in your works if you have benefited from using any of the freely available tools.
Q: Does BIAPSS use a third party software as a built-in part of its own web server?
No, we deeply respect the terms and conditions of the use of certain tools, which prohibit using them on third party servers. Our results from these state-of-the-art tools
can be successfully used as a benchmark on a specific group of proteins, and an additional benefit for the user is the derived consensus from those results.
The pre-calculated data, delivered in the agreed CSV format, is available for download in the Download tab, and interactive analysis is possible through
numerous BIAPSS applications.
At the same time, we sincerely encourage users who have found benefits in the BIAPSS repository to visit the Tools & References section in the Docs tab,
where they will find a list of all third-party tools used in our benchmark with suggested references.
Q: How is BIAPSS different from the other LLPS-related databases (PhaSePro, PhaSepDB, LLPSDB, drLLPS)?
BIAPSS is different in several major ways. First, in terms of sequence collection, BIAPPS is a superset, including all the available sequences with phase separation evidence.
It is not only the annotated database of known LLPS sequences but also it provides the precomputed downloadable repository of comprehensive bioinformatics analysis
on phase separating sequences. Additionally, BIAPSS is built for easy-to-use and interactive exploration (powered by Plotly-dash interface) of various physicochemical
characteristics (polarity, aromaticity, hydrophobicity, charge distribution); sequence-based predictions of evolutionary conservation, secondary structure,
solvent accessibility, structural disorder, contact maps; and broad detection of short linear motifs along the sequence (ELMs, LARKS, GARs, PTMs, steric zipper,
(tandem) repeats) that may prove to be key multivalent stretches of LLPS sequences. Further, future BIAPSS development includes a robust predictor of phase separation
behavior as well as the modeling tool that will bring functionality for aiding in data-driven modeling and design of synthetic LLPS membrane-less biocondensates.
Q: Does BIAPSS include all known LLPS sequences, and if not, how often will updates be made?
Yes, BIAPSS includes most of the known LLPS sequences. Currently, the content of BIAPSS resources covers known experimentally evidenced LLPS cases deposited in
PhaSePro and LLPSDB databases. Soon it will be extended with non-redundant cases from PhaSepDB and DrLLPS databases. Due to the constantly increasing number of deposits
in sequential databases, which are the basis of our analysis, we intend to recalculate the provided statistics once or twice a year.
Q: I can not find my sequence in the BIAPSS repository, so what to do?
BIAPPS, while including most of the evidenced LLPS sequences, is not updated in real-time hence there will inevitably be few new sequences that are not part of our repository.
That being, said in the future, we will have a robust predictor, which will allow inferring LLPS propensities and regions of sequence most likely to contribute to LLPS
based on the available data. For the moment, if the case is urgent, we recommend contacting us directly at abadacz@iastate.edu or start a new thread in the Disqus comment box
available in the Contact Us tab.
Q: Can I predict the phase separation prone regions in the sequence not included in the BIAPSS database or design synthetic LLPS sequences?
This is a functionality that will be added in the future.
Q: Does BIAPSS do calculations, or is it visualizing pre-calculated data?
Basically, BIAPSS is a repository, updated twice a year, containing pre-calculated data for a set of protein sequences, where the computational step was extensive
and time-consuming. This applies to all sequence-based predictions that required the initial preparation of multiple sequence alignment. Only minor additional
statistics and data transformation necessary for interactive adjustment to the graphs in individual applications are calculated on an ongoing basis. This solution
makes BIAPSS work as an instant server, interactively, and on-the-fly responding to the analytical needs of the user. Because our applications are currently dedicated
only to LLPS proteins that compose a limited and known subset, and because it would take several dozen to several hundred hours to perform a full bioinformatics
analysis for a single sequence, this solution is more economical and practical. A certain inconvenience is the lack of live updates, but the adopted refresh
rate of entire BIAPSS resources coincides with a significant increase in sequential databases. However, newly confirmed cases of LLPS proteins will be included in
BIAPSS resources immediately.
Q: What are the main assumptions behind BIAPPS applications? Why is it important feature X not included? How is the choice for including different apps made?
To the best of our knowledge, we have selected and analyzed various characteristics that may be relevant for the identification of multivalent interactions important
for structural disorder and/or phase separation behavior. Then, we provide a basic set of bioinformatic analyses based solely on the knowledge of the protein sequence and its
amino acid composition. The recent scientific insights suggesting features typical for intrinsically disordered regions or phase separation driving interactions are also
included, especially the presence of LARKS, steric zipper, Gly-Arg rich regions, Q-rich regions, the distribution of aromatic and pi-binding residues, etc. If you have
strong ideas for other factors that may affect membrane-less biocondensates, please contact us immediately, and we will be happy to assist you in the investigation against
the complete set of LLPS proteins.
Q: How reliable are the characteristics/predictions provided via BIAPSS?
Not all data collected in the BIAPSS repository are predictions. The repository is essentially divided into two main sections:
• SingleSEQ, where you will find details of the data in residue-resolution for a given sequence. Chemical patterns (polarity, hydrophobicity, aromatics,
and charge distributions along the sequence) are calculated directly from the amino acid composition of the selected sequence, similarly to the presence of short linear motifs.
Another one- and two-dimensional properties, such as the assignment of secondary structure, solvent availability, structural disorder, contact maps, and evolutionary conservation
are the sequence-based predictions. The accuracy of these predictions depends on the number of homologous sequences used and the quality of the initial multiple sequence
alignment (MSA), which is the basis for further predictions. Most of the tools (RAPTOR-X, PORTER-5, SPIDER-3, FESS, PaleAle5.0, SPOT) we employed to predict these characteristics
use HMMER or PSIBLAST to prepare an initial MSA profile. For some LLPS sequences it is very difficult to match homologous, so in order to increase the reliability of the
predictions we provide, we applied two treatments: 1) initial MSAs were made based on a search of the sequence databases with different levels of sequence identity:
SWISS-PROT, UniRef50, and UniRef90, respectively; 2) in addition to the originally calculated predictions using the state-of-the-art tools, we also include an estimated
objective consensus of these methods, derived from our algorithms.
• MultiSEQ, where you will find a comprehensive picture of phase-separated proteins treated as a group of proteins sharing common characteristics.
In this section, the data is provided in a sequence-resolution manner, where the average values for particular sequences are compiled together to show general tendencies
and regularities for the LLPS proteins subset.
We believe that there is sufficient data to see clear tendencies and hence using the BIAPSS resources is certainly more helpful than not using.
Q: BIAPSS results contradict my experiments/modeling assumptions, what does it mean? How can I justify the findings?
It should not happen that the data collected in the BIAPSS repository contradicts your experiment as long as you refer to the same protein sequence since our applications
mostly make sequence-based calculations. We recommend that you should use some care when interpreting individual sequence-based predictions, especially for cases where
MSA was constructed on less than 100 sequences (the number of sequences in MSA is given at the top of the Chemical Patterns application in a SingleSEQ tab).
Our recommendation based on deep experience in coarse-grained modeling suggests that it is better to use the consensus of various prediction methods or shorter but more accurate
predictions of specific characteristics (e.g. secondary structure data) since some specific errors can strongly distort the modeled three-dimensional structures.
It is possible that your experiment proves that another region of the sequence is crucial for phase separation or shows a structural disorder, then we would ask you to report it so that we can update our repository with your findings and add the source of new evidence.
Q: As an experimental researcher working with custom LLPS sequences, in what ways can BIAPSS help with my research?
BIAPSS can help place the selected sequence studied experimentally in the broader context of a group of proteins that were evidenced to show LLPS behavior.
We encourage you to explore the SingleSEQ tab, where the 8 applications provide the comprehensive description of detailed residue-resolution physicochemical characteristics
for selected LLPS protein, including 1) the brief statistical summary; 2) various chemical patterns compared on a single chart; 3) multiple sequence alignment against
selected databases and evolutionary conservation; sequence-based predictions of 4) secondary structure, 5) solvent accessibility, 6) structural disorder,
and 7) contact maps; 8) unique short linear motifs’ analyzer, where you can investigate the occurrence and colocation along a sequence of motifs typical
for phase-separated sequences or disordered proteins (LARKS, steric zipper, GARs, PTMs, ELMs, repeats). Therefore conclusions can be appropriately drawn whether
the phase behavior observed are unique or they fit well with the existing data. The available applications allow you to easily visually identify critical locations
in intrinsically disordered regions and/or fragments involved in phase separation, which can be a good starting point for planning point mutations in your experiments.
Q: Can BIAPSS tell something about protein-RNA LLPS?
BIAPSS is a repository providing in-depth bioinformatic analysis of protein sequences with evidenced phase separation behavior. Among this collection, you will surely find
cases of biocondensates involving both, protein and nucleic acids. The main application in the SingleSEQ tab contains a summary of a given LLPS protein,
including its UniProt ID, organism, gene, and common name. Using dropdowns you can search for the protein of interest. If necessary, we can easily extend the search options
of the repository with a keyword or groups of molecules jointly involved in the formation of a membrane-less biocondensate.
Additionally, you can identify new protein-RNA complexes using the Short Motifs SEQ application, also in the SingleSEQ tab, where you can easily identify short sticky fragments
typical for protein-nucleic acid interactions.